Chippewa vs Estonian 4 or more Vehicles in Household
COMPARE
Chippewa
Estonian
4 or more Vehicles in Household
4 or more Vehicles in Household Comparison
Chippewa
Estonians
7.6%
4 OR MORE VEHICLES IN HOUSEHOLD
100.0/ 100
METRIC RATING
62nd/ 347
METRIC RANK
6.4%
4 OR MORE VEHICLES IN HOUSEHOLD
55.1/ 100
METRIC RATING
169th/ 347
METRIC RANK
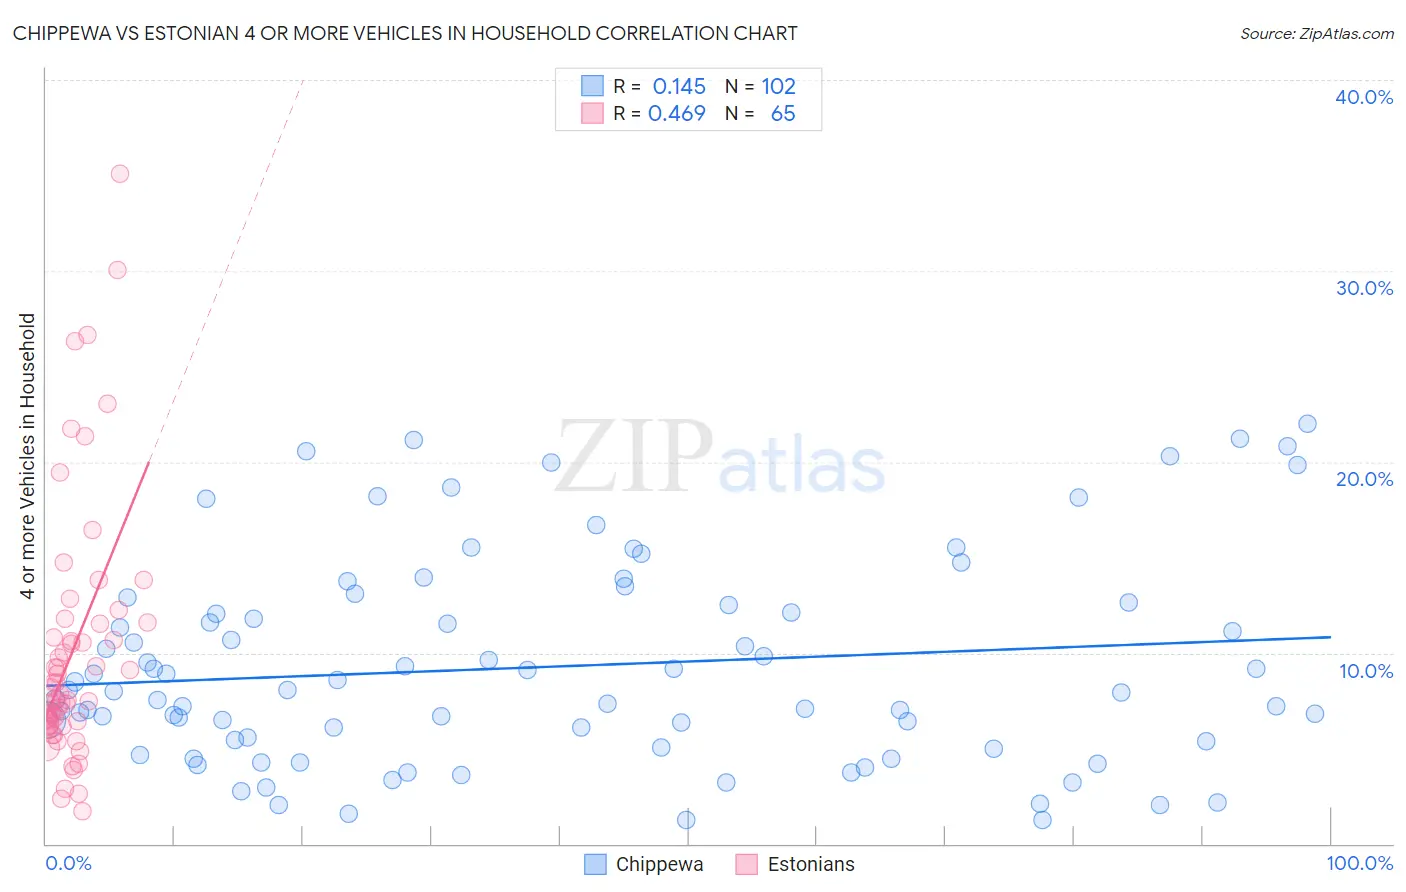
Chippewa vs Estonian 4 or more Vehicles in Household Correlation Chart
The statistical analysis conducted on geographies consisting of 214,617,305 people shows a poor positive correlation between the proportion of Chippewa and percentage of households with 4 or more vehicles available in the United States with a correlation coefficient (R) of 0.145 and weighted average of 7.6%. Similarly, the statistical analysis conducted on geographies consisting of 123,188,089 people shows a moderate positive correlation between the proportion of Estonians and percentage of households with 4 or more vehicles available in the United States with a correlation coefficient (R) of 0.469 and weighted average of 6.4%, a difference of 19.1%.
4 or more Vehicles in Household Correlation Summary
| Measurement | Chippewa | Estonian |
| Minimum | 1.2% | 1.7% |
| Maximum | 22.0% | 35.1% |
| Range | 20.8% | 33.4% |
| Mean | 9.3% | 10.1% |
| Median | 8.0% | 7.9% |
| Interquartile 25% (IQ1) | 5.4% | 6.2% |
| Interquartile 75% (IQ3) | 12.5% | 11.6% |
| Interquartile Range (IQR) | 7.1% | 5.3% |
| Standard Deviation (Sample) | 5.3% | 6.7% |
| Standard Deviation (Population) | 5.3% | 6.7% |
Similar Demographics by 4 or more Vehicles in Household
Demographics Similar to Chippewa by 4 or more Vehicles in Household
In terms of 4 or more vehicles in household, the demographic groups most similar to Chippewa are Immigrants from Micronesia (7.6%, a difference of 0.010%), Bangladeshi (7.6%, a difference of 0.25%), European (7.6%, a difference of 0.26%), Immigrants from the Azores (7.5%, a difference of 0.29%), and Spaniard (7.6%, a difference of 0.52%).
| Demographics | Rating | Rank | 4 or more Vehicles in Household |
| Immigrants | Oceania | 100.0 /100 | #55 | Exceptional 7.6% |
| English | 100.0 /100 | #56 | Exceptional 7.6% |
| Pennsylvania Germans | 100.0 /100 | #57 | Exceptional 7.6% |
| Swedes | 100.0 /100 | #58 | Exceptional 7.6% |
| Hispanics or Latinos | 100.0 /100 | #59 | Exceptional 7.6% |
| Spaniards | 100.0 /100 | #60 | Exceptional 7.6% |
| Europeans | 100.0 /100 | #61 | Exceptional 7.6% |
| Chippewa | 100.0 /100 | #62 | Exceptional 7.6% |
| Immigrants | Micronesia | 100.0 /100 | #63 | Exceptional 7.6% |
| Bangladeshis | 100.0 /100 | #64 | Exceptional 7.6% |
| Immigrants | Azores | 100.0 /100 | #65 | Exceptional 7.5% |
| Immigrants | Taiwan | 99.9 /100 | #66 | Exceptional 7.5% |
| Americans | 99.9 /100 | #67 | Exceptional 7.5% |
| Welsh | 99.9 /100 | #68 | Exceptional 7.5% |
| Germans | 99.9 /100 | #69 | Exceptional 7.5% |
Demographics Similar to Estonians by 4 or more Vehicles in Household
In terms of 4 or more vehicles in household, the demographic groups most similar to Estonians are Lebanese (6.4%, a difference of 0.070%), Polish (6.4%, a difference of 0.18%), Immigrants from Syria (6.3%, a difference of 0.24%), Immigrants from Denmark (6.4%, a difference of 0.28%), and Immigrants from India (6.3%, a difference of 0.32%).
| Demographics | Rating | Rank | 4 or more Vehicles in Household |
| Immigrants | Pakistan | 63.2 /100 | #162 | Good 6.4% |
| Chileans | 61.2 /100 | #163 | Good 6.4% |
| Hungarians | 61.1 /100 | #164 | Good 6.4% |
| Immigrants | Peru | 59.8 /100 | #165 | Average 6.4% |
| Immigrants | Denmark | 57.8 /100 | #166 | Average 6.4% |
| Poles | 56.9 /100 | #167 | Average 6.4% |
| Lebanese | 55.8 /100 | #168 | Average 6.4% |
| Estonians | 55.1 /100 | #169 | Average 6.4% |
| Immigrants | Syria | 52.8 /100 | #170 | Average 6.3% |
| Immigrants | India | 51.9 /100 | #171 | Average 6.3% |
| Immigrants | Lebanon | 51.7 /100 | #172 | Average 6.3% |
| Slovenes | 51.1 /100 | #173 | Average 6.3% |
| Lithuanians | 50.0 /100 | #174 | Average 6.3% |
| Immigrants | Western Europe | 48.8 /100 | #175 | Average 6.3% |
| Ukrainians | 47.6 /100 | #176 | Average 6.3% |