Chippewa vs Finnish 4 or more Vehicles in Household
COMPARE
Chippewa
Finnish
4 or more Vehicles in Household
4 or more Vehicles in Household Comparison
Chippewa
Finns
7.6%
4 OR MORE VEHICLES IN HOUSEHOLD
100.0/ 100
METRIC RATING
62nd/ 347
METRIC RANK
7.3%
4 OR MORE VEHICLES IN HOUSEHOLD
99.8/ 100
METRIC RATING
81st/ 347
METRIC RANK
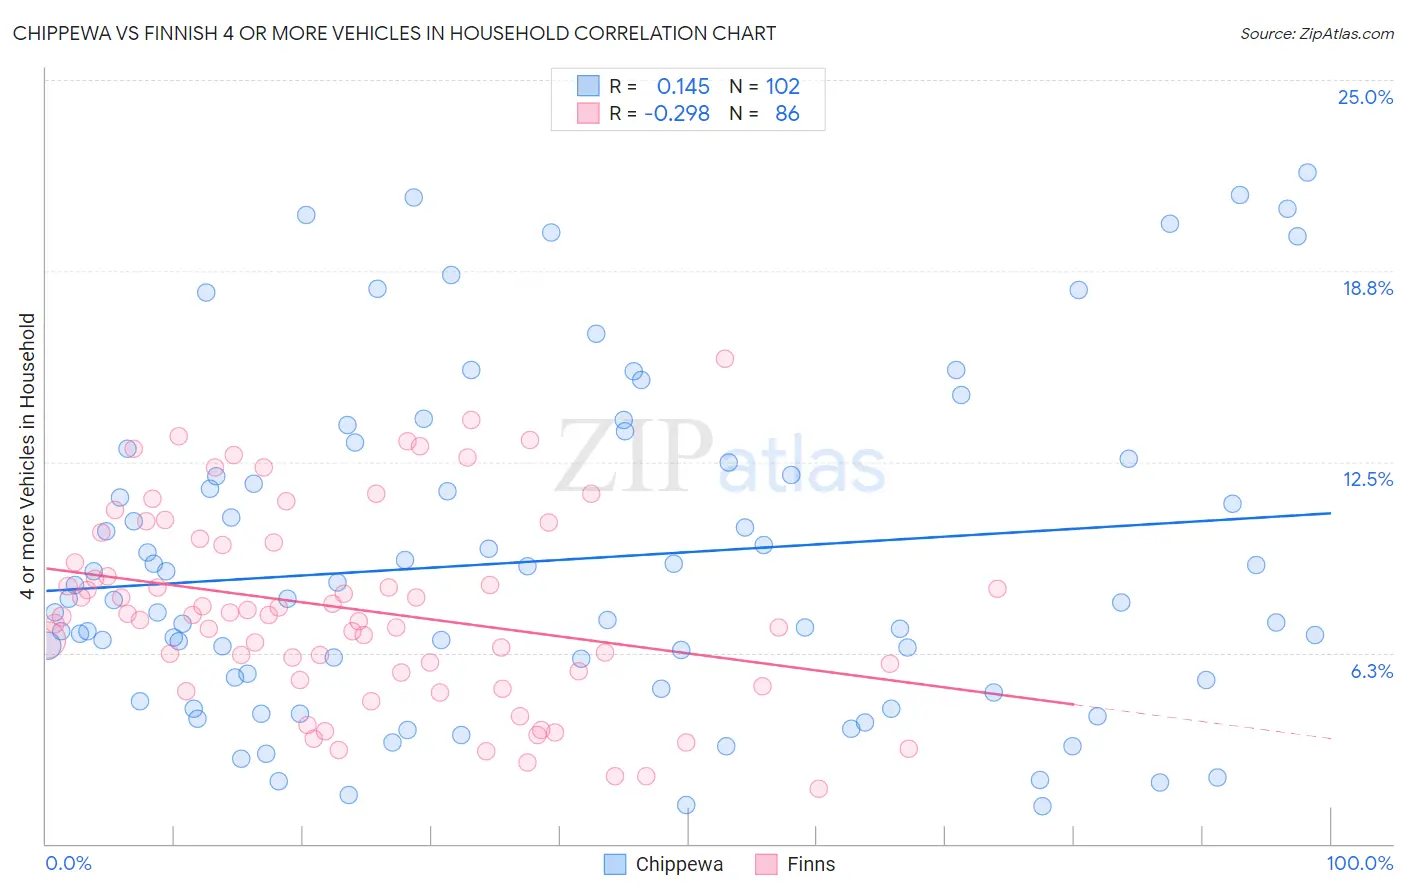
Chippewa vs Finnish 4 or more Vehicles in Household Correlation Chart
The statistical analysis conducted on geographies consisting of 214,617,305 people shows a poor positive correlation between the proportion of Chippewa and percentage of households with 4 or more vehicles available in the United States with a correlation coefficient (R) of 0.145 and weighted average of 7.6%. Similarly, the statistical analysis conducted on geographies consisting of 403,293,197 people shows a weak negative correlation between the proportion of Finns and percentage of households with 4 or more vehicles available in the United States with a correlation coefficient (R) of -0.298 and weighted average of 7.3%, a difference of 3.7%.
4 or more Vehicles in Household Correlation Summary
| Measurement | Chippewa | Finnish |
| Minimum | 1.2% | 1.8% |
| Maximum | 22.0% | 15.9% |
| Range | 20.8% | 14.0% |
| Mean | 9.3% | 7.7% |
| Median | 8.0% | 7.5% |
| Interquartile 25% (IQ1) | 5.4% | 5.6% |
| Interquartile 75% (IQ3) | 12.5% | 9.9% |
| Interquartile Range (IQR) | 7.1% | 4.3% |
| Standard Deviation (Sample) | 5.3% | 3.2% |
| Standard Deviation (Population) | 5.3% | 3.1% |
Demographics Similar to Chippewa and Finns by 4 or more Vehicles in Household
In terms of 4 or more vehicles in household, the demographic groups most similar to Chippewa are Immigrants from Micronesia (7.6%, a difference of 0.010%), Bangladeshi (7.6%, a difference of 0.25%), European (7.6%, a difference of 0.26%), Immigrants from the Azores (7.5%, a difference of 0.29%), and Immigrants from Taiwan (7.5%, a difference of 0.62%). Similarly, the demographic groups most similar to Finns are Alaska Native (7.3%, a difference of 0.56%), Czech (7.4%, a difference of 0.70%), White/Caucasian (7.4%, a difference of 0.87%), Apache (7.4%, a difference of 0.94%), and Laotian (7.4%, a difference of 1.1%).
| Demographics | Rating | Rank | 4 or more Vehicles in Household |
| Europeans | 100.0 /100 | #61 | Exceptional 7.6% |
| Chippewa | 100.0 /100 | #62 | Exceptional 7.6% |
| Immigrants | Micronesia | 100.0 /100 | #63 | Exceptional 7.6% |
| Bangladeshis | 100.0 /100 | #64 | Exceptional 7.6% |
| Immigrants | Azores | 100.0 /100 | #65 | Exceptional 7.5% |
| Immigrants | Taiwan | 99.9 /100 | #66 | Exceptional 7.5% |
| Americans | 99.9 /100 | #67 | Exceptional 7.5% |
| Welsh | 99.9 /100 | #68 | Exceptional 7.5% |
| Germans | 99.9 /100 | #69 | Exceptional 7.5% |
| Scottish | 99.9 /100 | #70 | Exceptional 7.4% |
| Chickasaw | 99.9 /100 | #71 | Exceptional 7.4% |
| Scotch-Irish | 99.9 /100 | #72 | Exceptional 7.4% |
| Portuguese | 99.9 /100 | #73 | Exceptional 7.4% |
| Icelanders | 99.9 /100 | #74 | Exceptional 7.4% |
| Immigrants | Cambodia | 99.9 /100 | #75 | Exceptional 7.4% |
| Laotians | 99.9 /100 | #76 | Exceptional 7.4% |
| Apache | 99.9 /100 | #77 | Exceptional 7.4% |
| Whites/Caucasians | 99.8 /100 | #78 | Exceptional 7.4% |
| Czechs | 99.8 /100 | #79 | Exceptional 7.4% |
| Alaska Natives | 99.8 /100 | #80 | Exceptional 7.3% |
| Finns | 99.8 /100 | #81 | Exceptional 7.3% |