Chippewa vs Immigrants from Indonesia 4 or more Vehicles in Household
COMPARE
Chippewa
Immigrants from Indonesia
4 or more Vehicles in Household
4 or more Vehicles in Household Comparison
Chippewa
Immigrants from Indonesia
7.6%
4 OR MORE VEHICLES IN HOUSEHOLD
100.0/ 100
METRIC RATING
62nd/ 347
METRIC RANK
7.2%
4 OR MORE VEHICLES IN HOUSEHOLD
99.6/ 100
METRIC RATING
86th/ 347
METRIC RANK
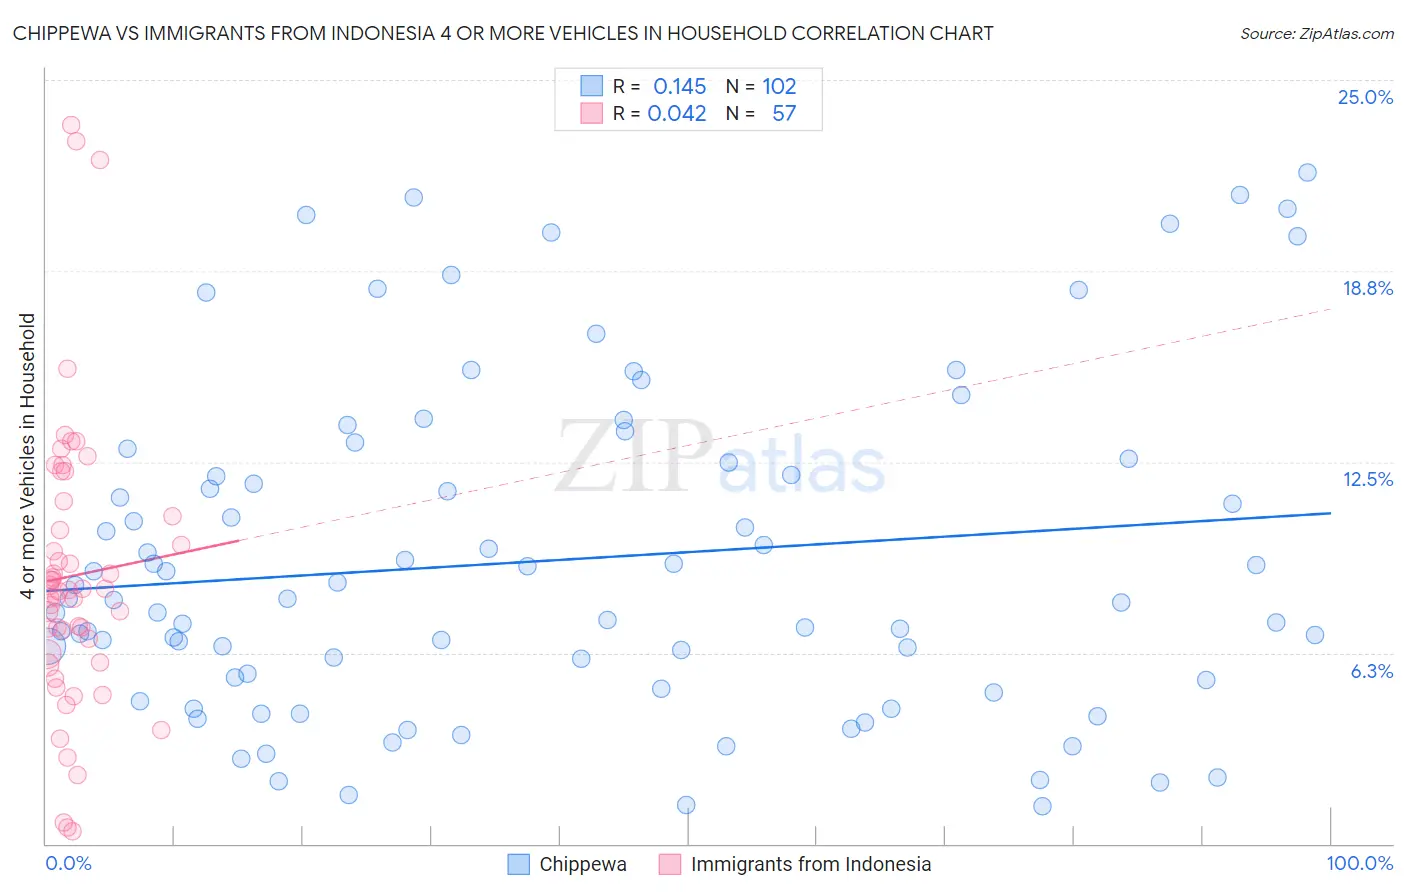
Chippewa vs Immigrants from Indonesia 4 or more Vehicles in Household Correlation Chart
The statistical analysis conducted on geographies consisting of 214,617,305 people shows a poor positive correlation between the proportion of Chippewa and percentage of households with 4 or more vehicles available in the United States with a correlation coefficient (R) of 0.145 and weighted average of 7.6%. Similarly, the statistical analysis conducted on geographies consisting of 214,959,702 people shows no correlation between the proportion of Immigrants from Indonesia and percentage of households with 4 or more vehicles available in the United States with a correlation coefficient (R) of 0.042 and weighted average of 7.2%, a difference of 4.7%.
4 or more Vehicles in Household Correlation Summary
| Measurement | Chippewa | Immigrants from Indonesia |
| Minimum | 1.2% | 0.42% |
| Maximum | 22.0% | 23.5% |
| Range | 20.8% | 23.1% |
| Mean | 9.3% | 8.8% |
| Median | 8.0% | 8.3% |
| Interquartile 25% (IQ1) | 5.4% | 6.1% |
| Interquartile 75% (IQ3) | 12.5% | 11.0% |
| Interquartile Range (IQR) | 7.1% | 4.9% |
| Standard Deviation (Sample) | 5.3% | 4.8% |
| Standard Deviation (Population) | 5.3% | 4.7% |
Similar Demographics by 4 or more Vehicles in Household
Demographics Similar to Chippewa by 4 or more Vehicles in Household
In terms of 4 or more vehicles in household, the demographic groups most similar to Chippewa are Immigrants from Micronesia (7.6%, a difference of 0.010%), Bangladeshi (7.6%, a difference of 0.25%), European (7.6%, a difference of 0.26%), Immigrants from the Azores (7.5%, a difference of 0.29%), and Spaniard (7.6%, a difference of 0.52%).
| Demographics | Rating | Rank | 4 or more Vehicles in Household |
| Immigrants | Oceania | 100.0 /100 | #55 | Exceptional 7.6% |
| English | 100.0 /100 | #56 | Exceptional 7.6% |
| Pennsylvania Germans | 100.0 /100 | #57 | Exceptional 7.6% |
| Swedes | 100.0 /100 | #58 | Exceptional 7.6% |
| Hispanics or Latinos | 100.0 /100 | #59 | Exceptional 7.6% |
| Spaniards | 100.0 /100 | #60 | Exceptional 7.6% |
| Europeans | 100.0 /100 | #61 | Exceptional 7.6% |
| Chippewa | 100.0 /100 | #62 | Exceptional 7.6% |
| Immigrants | Micronesia | 100.0 /100 | #63 | Exceptional 7.6% |
| Bangladeshis | 100.0 /100 | #64 | Exceptional 7.6% |
| Immigrants | Azores | 100.0 /100 | #65 | Exceptional 7.5% |
| Immigrants | Taiwan | 99.9 /100 | #66 | Exceptional 7.5% |
| Americans | 99.9 /100 | #67 | Exceptional 7.5% |
| Welsh | 99.9 /100 | #68 | Exceptional 7.5% |
| Germans | 99.9 /100 | #69 | Exceptional 7.5% |
Demographics Similar to Immigrants from Indonesia by 4 or more Vehicles in Household
In terms of 4 or more vehicles in household, the demographic groups most similar to Immigrants from Indonesia are Delaware (7.2%, a difference of 0.060%), Nonimmigrants (7.2%, a difference of 0.080%), Cree (7.2%, a difference of 0.18%), Afghan (7.3%, a difference of 0.35%), and British (7.2%, a difference of 0.41%).
| Demographics | Rating | Rank | 4 or more Vehicles in Household |
| Czechs | 99.8 /100 | #79 | Exceptional 7.4% |
| Alaska Natives | 99.8 /100 | #80 | Exceptional 7.3% |
| Finns | 99.8 /100 | #81 | Exceptional 7.3% |
| Northern Europeans | 99.8 /100 | #82 | Exceptional 7.3% |
| Potawatomi | 99.7 /100 | #83 | Exceptional 7.3% |
| Afghans | 99.7 /100 | #84 | Exceptional 7.3% |
| Cree | 99.7 /100 | #85 | Exceptional 7.2% |
| Immigrants | Indonesia | 99.6 /100 | #86 | Exceptional 7.2% |
| Delaware | 99.6 /100 | #87 | Exceptional 7.2% |
| Immigrants | Nonimmigrants | 99.6 /100 | #88 | Exceptional 7.2% |
| British | 99.6 /100 | #89 | Exceptional 7.2% |
| Creek | 99.6 /100 | #90 | Exceptional 7.2% |
| Assyrians/Chaldeans/Syriacs | 99.4 /100 | #91 | Exceptional 7.2% |
| Immigrants | Latin America | 99.4 /100 | #92 | Exceptional 7.1% |
| Immigrants | Afghanistan | 99.3 /100 | #93 | Exceptional 7.1% |