Venezuelan vs Estonian 4 or more Vehicles in Household
COMPARE
Venezuelan
Estonian
4 or more Vehicles in Household
4 or more Vehicles in Household Comparison
Venezuelans
Estonians
5.3%
4 OR MORE VEHICLES IN HOUSEHOLD
0.2/ 100
METRIC RATING
288th/ 347
METRIC RANK
6.4%
4 OR MORE VEHICLES IN HOUSEHOLD
55.1/ 100
METRIC RATING
169th/ 347
METRIC RANK
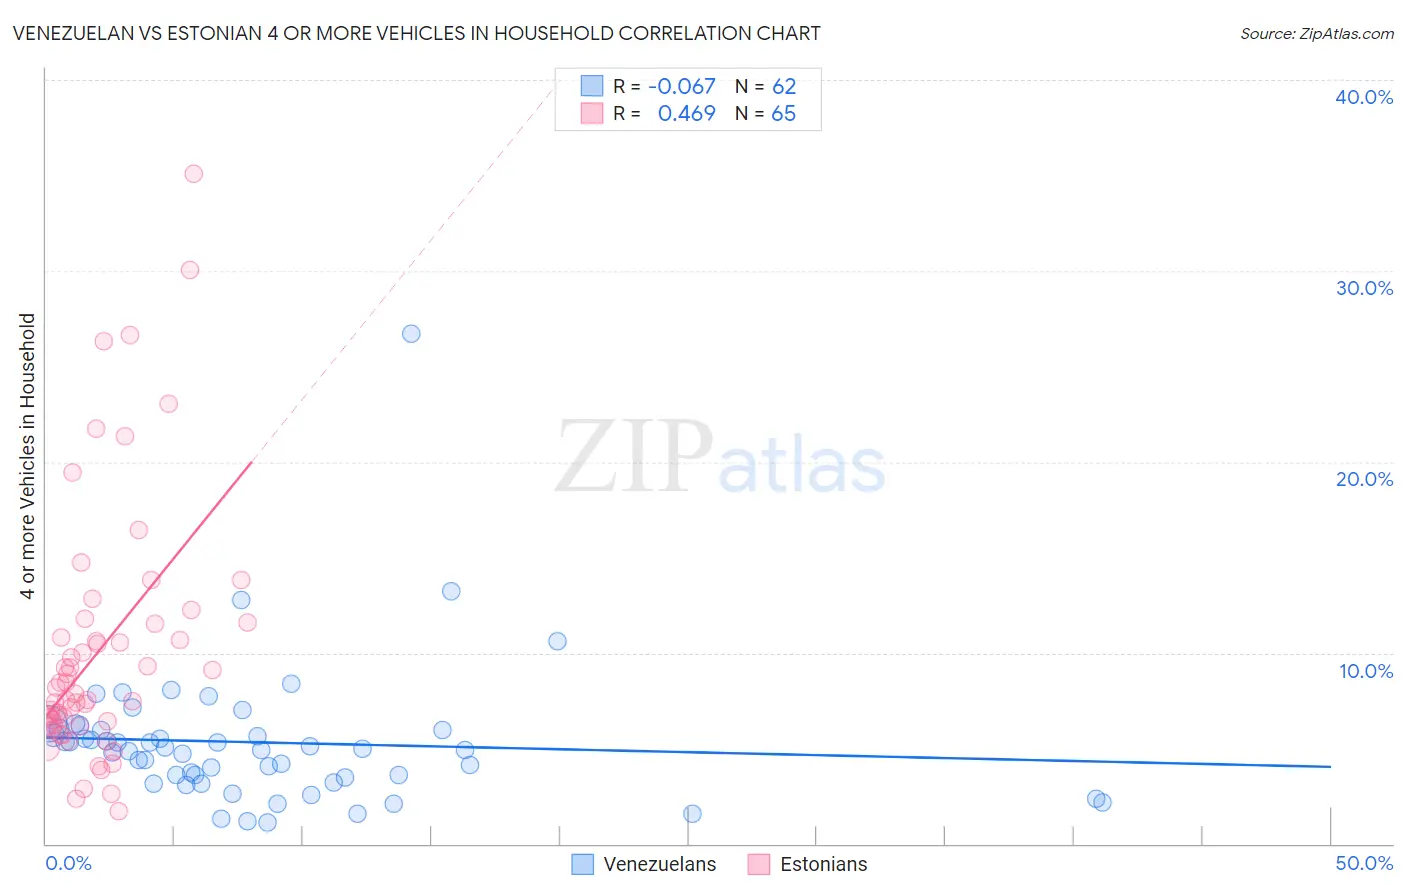
Venezuelan vs Estonian 4 or more Vehicles in Household Correlation Chart
The statistical analysis conducted on geographies consisting of 304,707,736 people shows a slight negative correlation between the proportion of Venezuelans and percentage of households with 4 or more vehicles available in the United States with a correlation coefficient (R) of -0.067 and weighted average of 5.3%. Similarly, the statistical analysis conducted on geographies consisting of 123,188,089 people shows a moderate positive correlation between the proportion of Estonians and percentage of households with 4 or more vehicles available in the United States with a correlation coefficient (R) of 0.469 and weighted average of 6.4%, a difference of 19.1%.
4 or more Vehicles in Household Correlation Summary
| Measurement | Venezuelan | Estonian |
| Minimum | 1.1% | 1.7% |
| Maximum | 26.7% | 35.1% |
| Range | 25.6% | 33.4% |
| Mean | 5.3% | 10.1% |
| Median | 5.0% | 7.9% |
| Interquartile 25% (IQ1) | 3.5% | 6.2% |
| Interquartile 75% (IQ3) | 6.0% | 11.6% |
| Interquartile Range (IQR) | 2.5% | 5.3% |
| Standard Deviation (Sample) | 3.7% | 6.7% |
| Standard Deviation (Population) | 3.7% | 6.7% |
Similar Demographics by 4 or more Vehicles in Household
Demographics Similar to Venezuelans by 4 or more Vehicles in Household
In terms of 4 or more vehicles in household, the demographic groups most similar to Venezuelans are Immigrants from Bosnia and Herzegovina (5.3%, a difference of 0.14%), Immigrants from Croatia (5.4%, a difference of 0.19%), Immigrants from Colombia (5.4%, a difference of 0.28%), Immigrants from Liberia (5.4%, a difference of 0.32%), and Immigrants from Russia (5.3%, a difference of 0.44%).
| Demographics | Rating | Rank | 4 or more Vehicles in Household |
| Immigrants | Western Africa | 0.3 /100 | #281 | Tragic 5.4% |
| Immigrants | Spain | 0.3 /100 | #282 | Tragic 5.4% |
| Immigrants | Ireland | 0.3 /100 | #283 | Tragic 5.4% |
| Brazilians | 0.3 /100 | #284 | Tragic 5.4% |
| Immigrants | Liberia | 0.2 /100 | #285 | Tragic 5.4% |
| Immigrants | Colombia | 0.2 /100 | #286 | Tragic 5.4% |
| Immigrants | Croatia | 0.2 /100 | #287 | Tragic 5.4% |
| Venezuelans | 0.2 /100 | #288 | Tragic 5.3% |
| Immigrants | Bosnia and Herzegovina | 0.2 /100 | #289 | Tragic 5.3% |
| Immigrants | Russia | 0.2 /100 | #290 | Tragic 5.3% |
| Immigrants | Bahamas | 0.1 /100 | #291 | Tragic 5.3% |
| Liberians | 0.1 /100 | #292 | Tragic 5.3% |
| Immigrants | Congo | 0.1 /100 | #293 | Tragic 5.2% |
| Ghanaians | 0.1 /100 | #294 | Tragic 5.2% |
| Immigrants | Brazil | 0.1 /100 | #295 | Tragic 5.2% |
Demographics Similar to Estonians by 4 or more Vehicles in Household
In terms of 4 or more vehicles in household, the demographic groups most similar to Estonians are Lebanese (6.4%, a difference of 0.070%), Polish (6.4%, a difference of 0.18%), Immigrants from Syria (6.3%, a difference of 0.24%), Immigrants from Denmark (6.4%, a difference of 0.28%), and Immigrants from India (6.3%, a difference of 0.32%).
| Demographics | Rating | Rank | 4 or more Vehicles in Household |
| Immigrants | Pakistan | 63.2 /100 | #162 | Good 6.4% |
| Chileans | 61.2 /100 | #163 | Good 6.4% |
| Hungarians | 61.1 /100 | #164 | Good 6.4% |
| Immigrants | Peru | 59.8 /100 | #165 | Average 6.4% |
| Immigrants | Denmark | 57.8 /100 | #166 | Average 6.4% |
| Poles | 56.9 /100 | #167 | Average 6.4% |
| Lebanese | 55.8 /100 | #168 | Average 6.4% |
| Estonians | 55.1 /100 | #169 | Average 6.4% |
| Immigrants | Syria | 52.8 /100 | #170 | Average 6.3% |
| Immigrants | India | 51.9 /100 | #171 | Average 6.3% |
| Immigrants | Lebanon | 51.7 /100 | #172 | Average 6.3% |
| Slovenes | 51.1 /100 | #173 | Average 6.3% |
| Lithuanians | 50.0 /100 | #174 | Average 6.3% |
| Immigrants | Western Europe | 48.8 /100 | #175 | Average 6.3% |
| Ukrainians | 47.6 /100 | #176 | Average 6.3% |