Immigrants from Greece vs Estonian 4 or more Vehicles in Household
COMPARE
Immigrants from Greece
Estonian
4 or more Vehicles in Household
4 or more Vehicles in Household Comparison
Immigrants from Greece
Estonians
5.1%
4 OR MORE VEHICLES IN HOUSEHOLD
0.0/ 100
METRIC RATING
303rd/ 347
METRIC RANK
6.4%
4 OR MORE VEHICLES IN HOUSEHOLD
55.1/ 100
METRIC RATING
169th/ 347
METRIC RANK
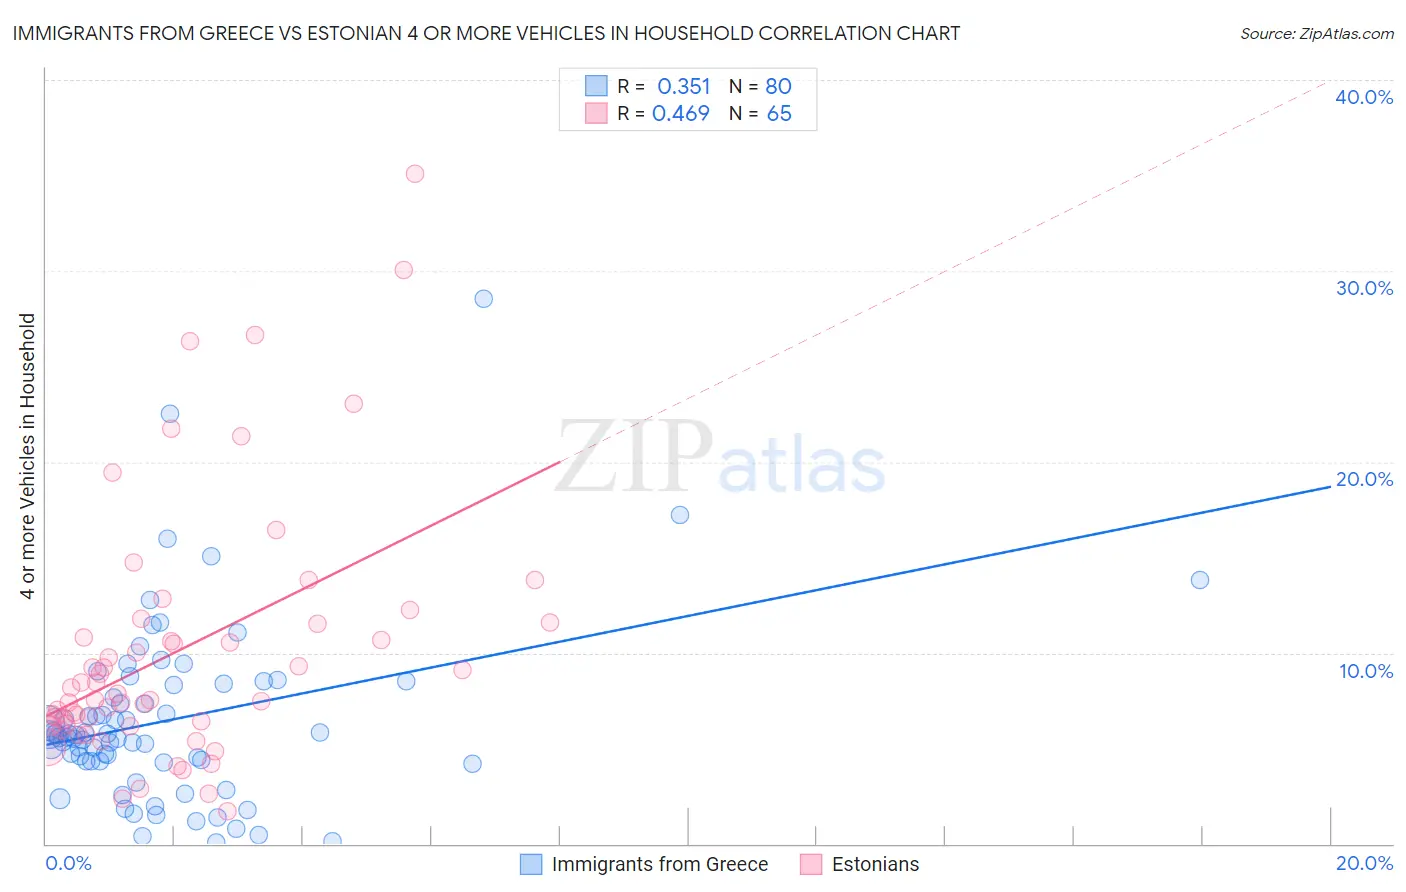
Immigrants from Greece vs Estonian 4 or more Vehicles in Household Correlation Chart
The statistical analysis conducted on geographies consisting of 215,892,328 people shows a mild positive correlation between the proportion of Immigrants from Greece and percentage of households with 4 or more vehicles available in the United States with a correlation coefficient (R) of 0.351 and weighted average of 5.1%. Similarly, the statistical analysis conducted on geographies consisting of 123,188,089 people shows a moderate positive correlation between the proportion of Estonians and percentage of households with 4 or more vehicles available in the United States with a correlation coefficient (R) of 0.469 and weighted average of 6.4%, a difference of 25.8%.
4 or more Vehicles in Household Correlation Summary
| Measurement | Immigrants from Greece | Estonian |
| Minimum | 0.039% | 1.7% |
| Maximum | 28.6% | 35.1% |
| Range | 28.5% | 33.4% |
| Mean | 6.5% | 10.1% |
| Median | 5.6% | 7.9% |
| Interquartile 25% (IQ1) | 4.3% | 6.2% |
| Interquartile 75% (IQ3) | 8.4% | 11.6% |
| Interquartile Range (IQR) | 4.1% | 5.3% |
| Standard Deviation (Sample) | 4.7% | 6.7% |
| Standard Deviation (Population) | 4.7% | 6.7% |
Similar Demographics by 4 or more Vehicles in Household
Demographics Similar to Immigrants from Greece by 4 or more Vehicles in Household
In terms of 4 or more vehicles in household, the demographic groups most similar to Immigrants from Greece are Bahamian (5.1%, a difference of 0.47%), Cypriot (5.0%, a difference of 0.55%), Somali (5.0%, a difference of 0.56%), Immigrants from Serbia (5.0%, a difference of 0.64%), and Immigrants from Zaire (5.1%, a difference of 0.77%).
| Demographics | Rating | Rank | 4 or more Vehicles in Household |
| Israelis | 0.1 /100 | #296 | Tragic 5.2% |
| Immigrants | Venezuela | 0.1 /100 | #297 | Tragic 5.2% |
| Immigrants | South America | 0.1 /100 | #298 | Tragic 5.2% |
| Immigrants | Ghana | 0.1 /100 | #299 | Tragic 5.2% |
| Immigrants | Morocco | 0.0 /100 | #300 | Tragic 5.1% |
| Immigrants | Zaire | 0.0 /100 | #301 | Tragic 5.1% |
| Bahamians | 0.0 /100 | #302 | Tragic 5.1% |
| Immigrants | Greece | 0.0 /100 | #303 | Tragic 5.1% |
| Cypriots | 0.0 /100 | #304 | Tragic 5.0% |
| Somalis | 0.0 /100 | #305 | Tragic 5.0% |
| Immigrants | Serbia | 0.0 /100 | #306 | Tragic 5.0% |
| Menominee | 0.0 /100 | #307 | Tragic 5.0% |
| Paraguayans | 0.0 /100 | #308 | Tragic 4.9% |
| Immigrants | Somalia | 0.0 /100 | #309 | Tragic 4.9% |
| Moroccans | 0.0 /100 | #310 | Tragic 4.9% |
Demographics Similar to Estonians by 4 or more Vehicles in Household
In terms of 4 or more vehicles in household, the demographic groups most similar to Estonians are Lebanese (6.4%, a difference of 0.070%), Polish (6.4%, a difference of 0.18%), Immigrants from Syria (6.3%, a difference of 0.24%), Immigrants from Denmark (6.4%, a difference of 0.28%), and Immigrants from India (6.3%, a difference of 0.32%).
| Demographics | Rating | Rank | 4 or more Vehicles in Household |
| Immigrants | Pakistan | 63.2 /100 | #162 | Good 6.4% |
| Chileans | 61.2 /100 | #163 | Good 6.4% |
| Hungarians | 61.1 /100 | #164 | Good 6.4% |
| Immigrants | Peru | 59.8 /100 | #165 | Average 6.4% |
| Immigrants | Denmark | 57.8 /100 | #166 | Average 6.4% |
| Poles | 56.9 /100 | #167 | Average 6.4% |
| Lebanese | 55.8 /100 | #168 | Average 6.4% |
| Estonians | 55.1 /100 | #169 | Average 6.4% |
| Immigrants | Syria | 52.8 /100 | #170 | Average 6.3% |
| Immigrants | India | 51.9 /100 | #171 | Average 6.3% |
| Immigrants | Lebanon | 51.7 /100 | #172 | Average 6.3% |
| Slovenes | 51.1 /100 | #173 | Average 6.3% |
| Lithuanians | 50.0 /100 | #174 | Average 6.3% |
| Immigrants | Western Europe | 48.8 /100 | #175 | Average 6.3% |
| Ukrainians | 47.6 /100 | #176 | Average 6.3% |