Immigrants from Eritrea vs Yugoslavian 4 or more Vehicles in Household
COMPARE
Immigrants from Eritrea
Yugoslavian
4 or more Vehicles in Household
4 or more Vehicles in Household Comparison
Immigrants from Eritrea
Yugoslavians
5.8%
4 OR MORE VEHICLES IN HOUSEHOLD
4.5/ 100
METRIC RATING
236th/ 347
METRIC RANK
6.3%
4 OR MORE VEHICLES IN HOUSEHOLD
41.1/ 100
METRIC RATING
181st/ 347
METRIC RANK
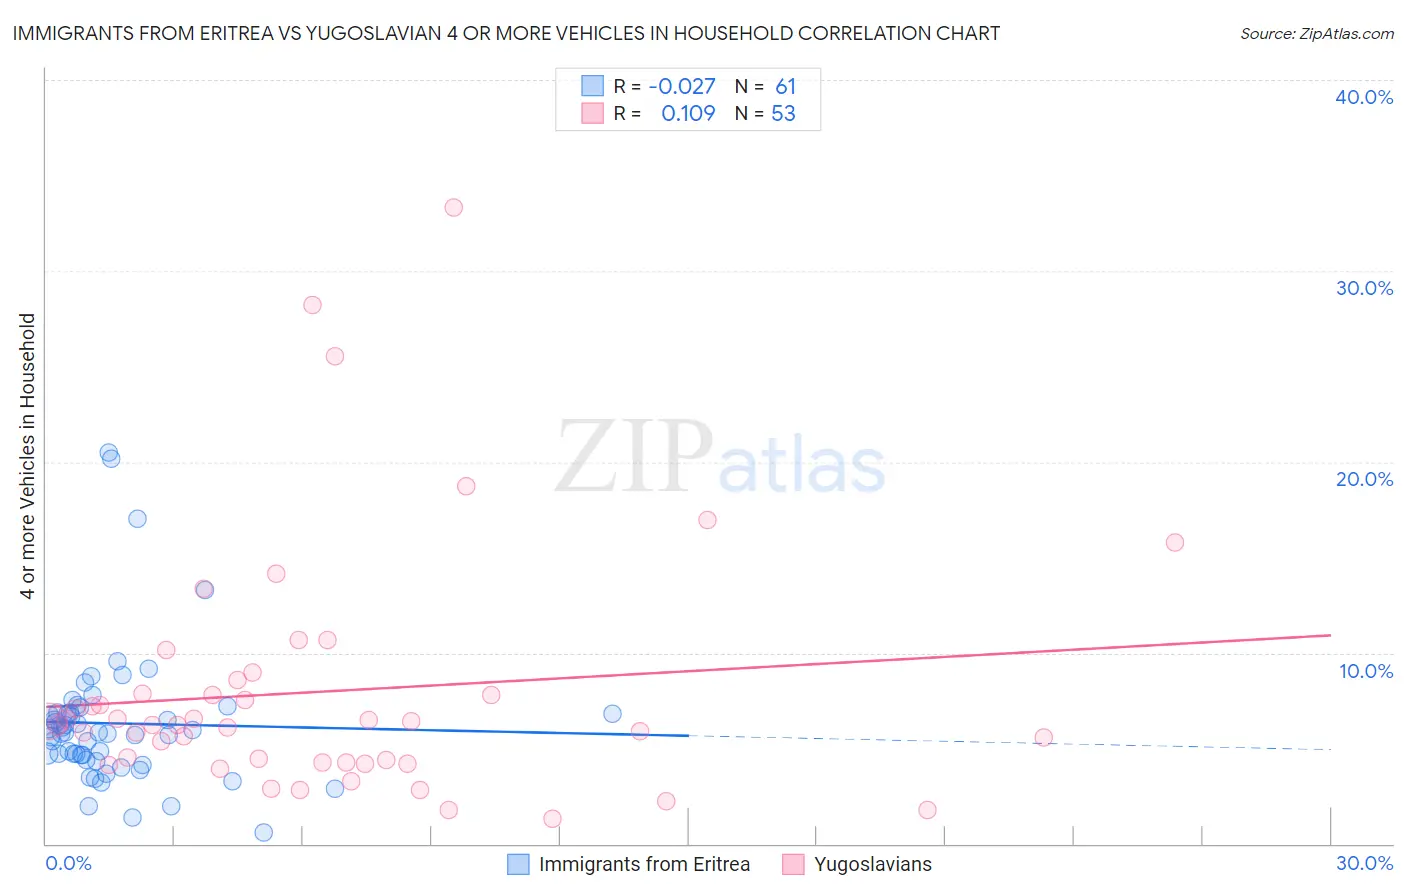
Immigrants from Eritrea vs Yugoslavian 4 or more Vehicles in Household Correlation Chart
The statistical analysis conducted on geographies consisting of 104,728,093 people shows no correlation between the proportion of Immigrants from Eritrea and percentage of households with 4 or more vehicles available in the United States with a correlation coefficient (R) of -0.027 and weighted average of 5.8%. Similarly, the statistical analysis conducted on geographies consisting of 285,036,674 people shows a poor positive correlation between the proportion of Yugoslavians and percentage of households with 4 or more vehicles available in the United States with a correlation coefficient (R) of 0.109 and weighted average of 6.3%, a difference of 7.4%.
4 or more Vehicles in Household Correlation Summary
| Measurement | Immigrants from Eritrea | Yugoslavian |
| Minimum | 0.61% | 1.3% |
| Maximum | 20.5% | 33.3% |
| Range | 19.9% | 32.1% |
| Mean | 6.3% | 8.0% |
| Median | 5.8% | 6.2% |
| Interquartile 25% (IQ1) | 4.5% | 4.3% |
| Interquartile 75% (IQ3) | 6.9% | 8.2% |
| Interquartile Range (IQR) | 2.4% | 3.9% |
| Standard Deviation (Sample) | 3.6% | 6.4% |
| Standard Deviation (Population) | 3.6% | 6.4% |
Similar Demographics by 4 or more Vehicles in Household
Demographics Similar to Immigrants from Eritrea by 4 or more Vehicles in Household
In terms of 4 or more vehicles in household, the demographic groups most similar to Immigrants from Eritrea are Immigrants from Hungary (5.8%, a difference of 0.010%), African (5.8%, a difference of 0.030%), Turkish (5.8%, a difference of 0.27%), Immigrants from Belgium (5.8%, a difference of 0.40%), and Immigrants from Australia (5.8%, a difference of 0.49%).
| Demographics | Rating | Rank | 4 or more Vehicles in Household |
| Eastern Europeans | 6.8 /100 | #229 | Tragic 5.9% |
| Immigrants | Malaysia | 6.7 /100 | #230 | Tragic 5.9% |
| Immigrants | Switzerland | 6.4 /100 | #231 | Tragic 5.9% |
| Immigrants | Argentina | 6.0 /100 | #232 | Tragic 5.9% |
| Sierra Leoneans | 6.0 /100 | #233 | Tragic 5.9% |
| Africans | 4.6 /100 | #234 | Tragic 5.8% |
| Immigrants | Hungary | 4.6 /100 | #235 | Tragic 5.8% |
| Immigrants | Eritrea | 4.5 /100 | #236 | Tragic 5.8% |
| Turks | 4.1 /100 | #237 | Tragic 5.8% |
| Immigrants | Belgium | 4.0 /100 | #238 | Tragic 5.8% |
| Immigrants | Australia | 3.8 /100 | #239 | Tragic 5.8% |
| Immigrants | Poland | 3.8 /100 | #240 | Tragic 5.8% |
| Mongolians | 3.7 /100 | #241 | Tragic 5.8% |
| Immigrants | Middle Africa | 3.4 /100 | #242 | Tragic 5.8% |
| Immigrants | Czechoslovakia | 3.2 /100 | #243 | Tragic 5.8% |
Demographics Similar to Yugoslavians by 4 or more Vehicles in Household
In terms of 4 or more vehicles in household, the demographic groups most similar to Yugoslavians are South American Indian (6.3%, a difference of 0.050%), Syrian (6.3%, a difference of 0.090%), Immigrants from Japan (6.3%, a difference of 0.20%), Belizean (6.3%, a difference of 0.35%), and Immigrants from Burma/Myanmar (6.2%, a difference of 0.39%).
| Demographics | Rating | Rank | 4 or more Vehicles in Household |
| Lithuanians | 50.0 /100 | #174 | Average 6.3% |
| Immigrants | Western Europe | 48.8 /100 | #175 | Average 6.3% |
| Ukrainians | 47.6 /100 | #176 | Average 6.3% |
| Slovaks | 46.9 /100 | #177 | Average 6.3% |
| Belizeans | 44.5 /100 | #178 | Average 6.3% |
| Immigrants | Japan | 43.1 /100 | #179 | Average 6.3% |
| Syrians | 42.0 /100 | #180 | Average 6.3% |
| Yugoslavians | 41.1 /100 | #181 | Average 6.3% |
| South American Indians | 40.7 /100 | #182 | Average 6.3% |
| Immigrants | Burma/Myanmar | 37.5 /100 | #183 | Fair 6.2% |
| Iraqis | 37.3 /100 | #184 | Fair 6.2% |
| Thais | 36.9 /100 | #185 | Fair 6.2% |
| Immigrants | Northern Europe | 36.8 /100 | #186 | Fair 6.2% |
| Immigrants | South Africa | 35.4 /100 | #187 | Fair 6.2% |
| Kiowa | 34.7 /100 | #188 | Fair 6.2% |