Cheyenne vs Yugoslavian No Schooling Completed
COMPARE
Cheyenne
Yugoslavian
No Schooling Completed
No Schooling Completed Comparison
Cheyenne
Yugoslavians
2.1%
NO SCHOOLING COMPLETED
58.6/ 100
METRIC RATING
168th/ 347
METRIC RANK
1.8%
NO SCHOOLING COMPLETED
97.2/ 100
METRIC RATING
107th/ 347
METRIC RANK
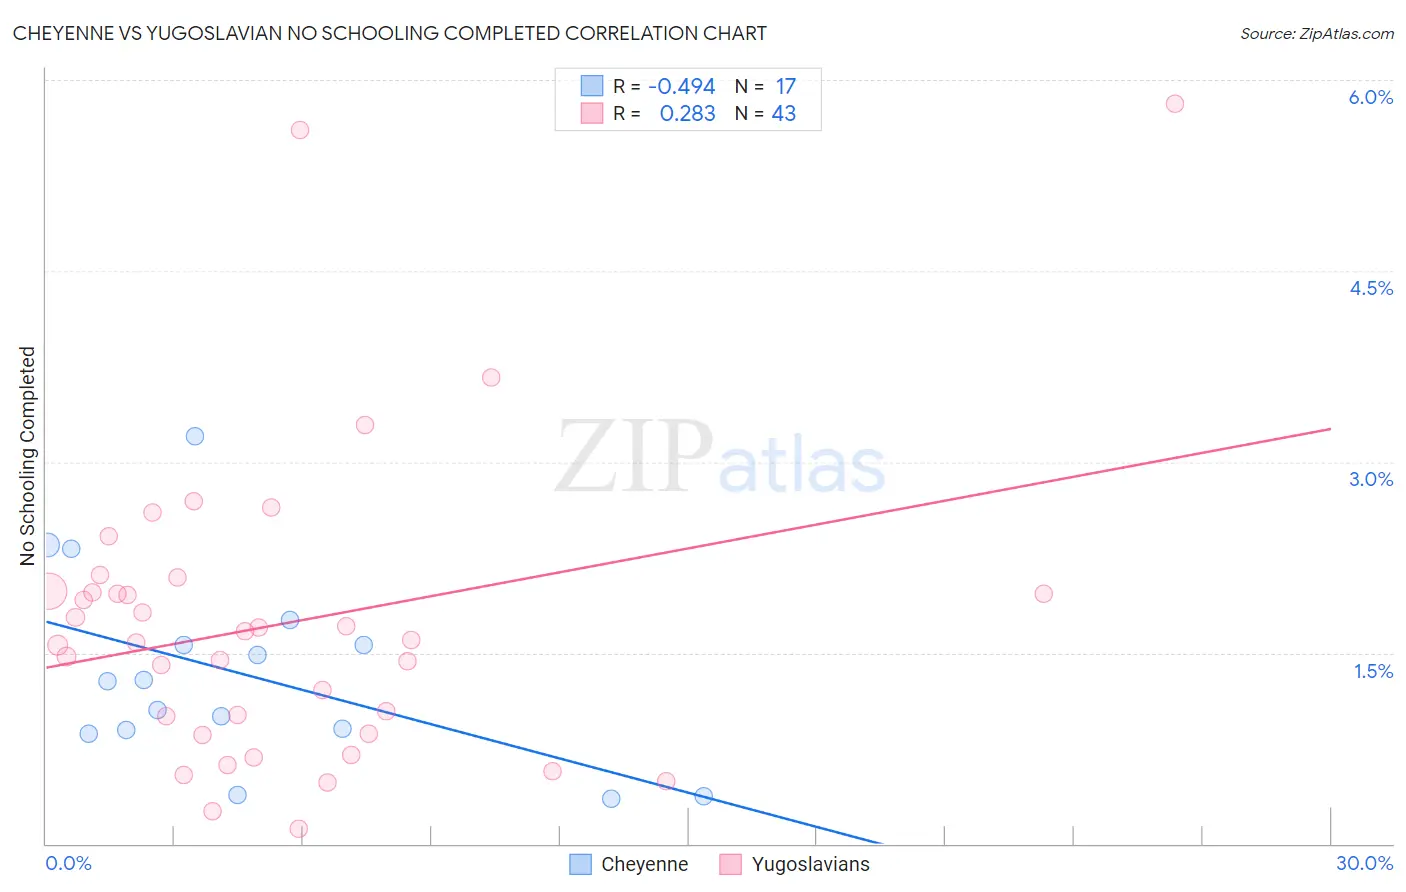
Cheyenne vs Yugoslavian No Schooling Completed Correlation Chart
The statistical analysis conducted on geographies consisting of 80,362,041 people shows a moderate negative correlation between the proportion of Cheyenne and percentage of population with no schooling in the United States with a correlation coefficient (R) of -0.494 and weighted average of 2.1%. Similarly, the statistical analysis conducted on geographies consisting of 283,637,771 people shows a weak positive correlation between the proportion of Yugoslavians and percentage of population with no schooling in the United States with a correlation coefficient (R) of 0.283 and weighted average of 1.8%, a difference of 12.2%.
No Schooling Completed Correlation Summary
| Measurement | Cheyenne | Yugoslavian |
| Minimum | 0.36% | 0.12% |
| Maximum | 3.2% | 5.8% |
| Range | 2.8% | 5.7% |
| Mean | 1.3% | 1.7% |
| Median | 1.3% | 1.6% |
| Interquartile 25% (IQ1) | 0.88% | 0.86% |
| Interquartile 75% (IQ3) | 1.7% | 2.0% |
| Interquartile Range (IQR) | 0.78% | 1.1% |
| Standard Deviation (Sample) | 0.76% | 1.2% |
| Standard Deviation (Population) | 0.74% | 1.2% |
Similar Demographics by No Schooling Completed
Demographics Similar to Cheyenne by No Schooling Completed
In terms of no schooling completed, the demographic groups most similar to Cheyenne are Egyptian (2.1%, a difference of 0.080%), Dutch West Indian (2.1%, a difference of 0.18%), Brazilian (2.1%, a difference of 0.23%), Apache (2.1%, a difference of 0.27%), and Comanche (2.1%, a difference of 0.29%).
| Demographics | Rating | Rank | No Schooling Completed |
| Ugandans | 64.6 /100 | #161 | Good 2.0% |
| Immigrants | Brazil | 63.8 /100 | #162 | Good 2.1% |
| Albanians | 62.2 /100 | #163 | Good 2.1% |
| Comanche | 60.7 /100 | #164 | Good 2.1% |
| Brazilians | 60.2 /100 | #165 | Good 2.1% |
| Dutch West Indians | 59.9 /100 | #166 | Average 2.1% |
| Egyptians | 59.2 /100 | #167 | Average 2.1% |
| Cheyenne | 58.6 /100 | #168 | Average 2.1% |
| Apache | 56.7 /100 | #169 | Average 2.1% |
| Argentineans | 56.0 /100 | #170 | Average 2.1% |
| Immigrants | Poland | 55.2 /100 | #171 | Average 2.1% |
| Immigrants | Argentina | 52.7 /100 | #172 | Average 2.1% |
| Immigrants | Belarus | 51.8 /100 | #173 | Average 2.1% |
| Immigrants | Micronesia | 50.0 /100 | #174 | Average 2.1% |
| Arabs | 46.4 /100 | #175 | Average 2.1% |
Demographics Similar to Yugoslavians by No Schooling Completed
In terms of no schooling completed, the demographic groups most similar to Yugoslavians are Immigrants from France (1.8%, a difference of 0.040%), Okinawan (1.8%, a difference of 0.22%), German Russian (1.8%, a difference of 0.44%), Thai (1.8%, a difference of 0.46%), and Immigrants from Saudi Arabia (1.9%, a difference of 0.57%).
| Demographics | Rating | Rank | No Schooling Completed |
| Immigrants | Singapore | 98.0 /100 | #100 | Exceptional 1.8% |
| Immigrants | Czechoslovakia | 97.9 /100 | #101 | Exceptional 1.8% |
| Immigrants | Switzerland | 97.9 /100 | #102 | Exceptional 1.8% |
| Basques | 97.9 /100 | #103 | Exceptional 1.8% |
| Thais | 97.5 /100 | #104 | Exceptional 1.8% |
| German Russians | 97.5 /100 | #105 | Exceptional 1.8% |
| Immigrants | France | 97.3 /100 | #106 | Exceptional 1.8% |
| Yugoslavians | 97.2 /100 | #107 | Exceptional 1.8% |
| Okinawans | 97.1 /100 | #108 | Exceptional 1.8% |
| Immigrants | Saudi Arabia | 96.8 /100 | #109 | Exceptional 1.9% |
| Immigrants | Latvia | 96.7 /100 | #110 | Exceptional 1.9% |
| Immigrants | Japan | 96.6 /100 | #111 | Exceptional 1.9% |
| Pueblo | 96.4 /100 | #112 | Exceptional 1.9% |
| Immigrants | Zimbabwe | 96.2 /100 | #113 | Exceptional 1.9% |
| Immigrants | Norway | 96.1 /100 | #114 | Exceptional 1.9% |