Costa Rican vs Yugoslavian 4 or more Vehicles in Household
COMPARE
Costa Rican
Yugoslavian
4 or more Vehicles in Household
4 or more Vehicles in Household Comparison
Costa Ricans
Yugoslavians
6.8%
4 OR MORE VEHICLES IN HOUSEHOLD
95.5/ 100
METRIC RATING
119th/ 347
METRIC RANK
6.3%
4 OR MORE VEHICLES IN HOUSEHOLD
41.1/ 100
METRIC RATING
181st/ 347
METRIC RANK
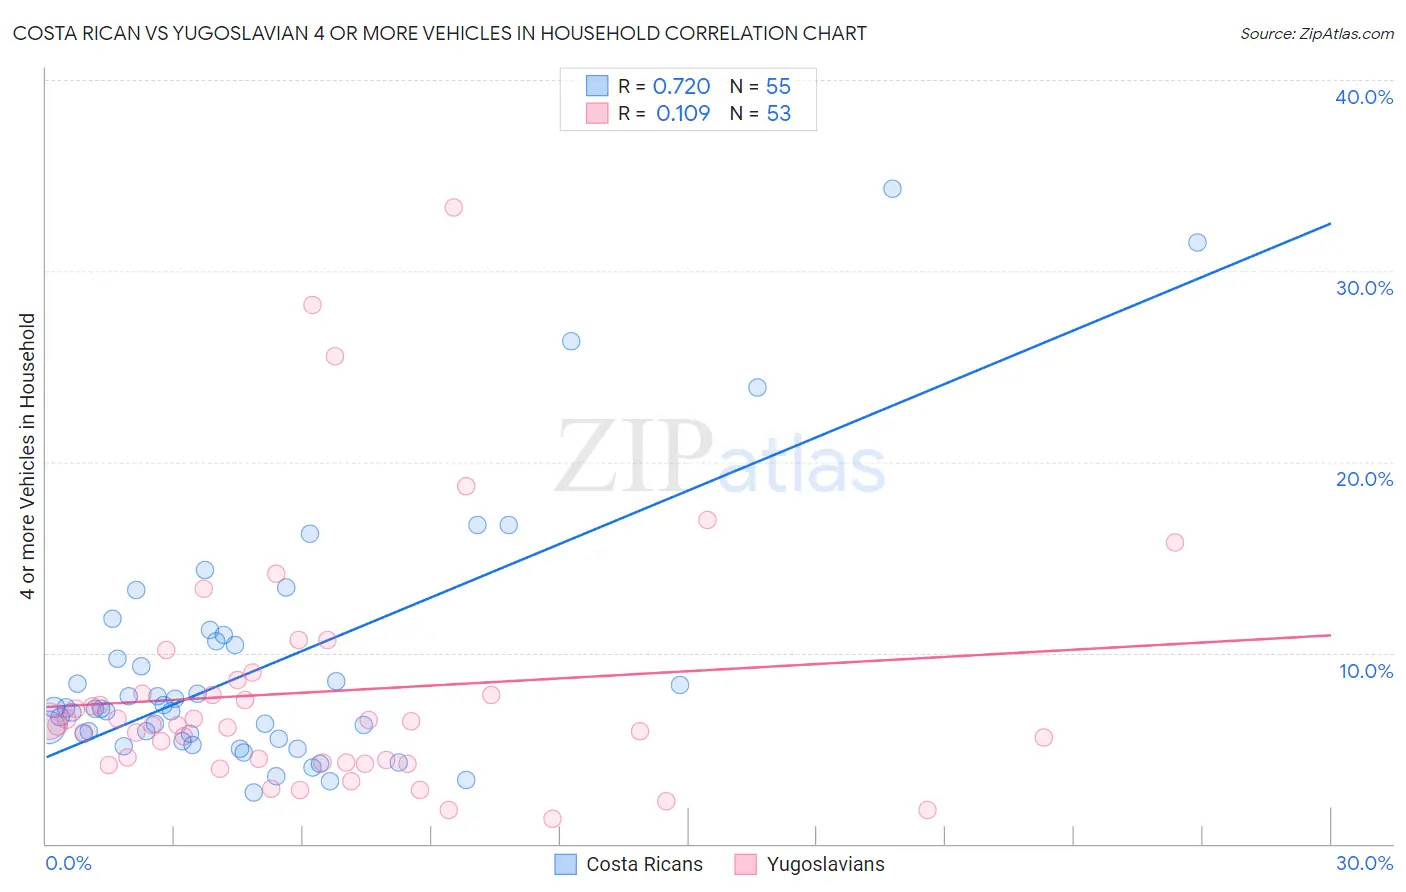
Costa Rican vs Yugoslavian 4 or more Vehicles in Household Correlation Chart
The statistical analysis conducted on geographies consisting of 252,442,983 people shows a strong positive correlation between the proportion of Costa Ricans and percentage of households with 4 or more vehicles available in the United States with a correlation coefficient (R) of 0.720 and weighted average of 6.8%. Similarly, the statistical analysis conducted on geographies consisting of 285,036,674 people shows a poor positive correlation between the proportion of Yugoslavians and percentage of households with 4 or more vehicles available in the United States with a correlation coefficient (R) of 0.109 and weighted average of 6.3%, a difference of 8.7%.
4 or more Vehicles in Household Correlation Summary
| Measurement | Costa Rican | Yugoslavian |
| Minimum | 2.7% | 1.3% |
| Maximum | 34.3% | 33.3% |
| Range | 31.6% | 32.1% |
| Mean | 9.3% | 8.0% |
| Median | 7.1% | 6.2% |
| Interquartile 25% (IQ1) | 5.5% | 4.3% |
| Interquartile 75% (IQ3) | 10.6% | 8.2% |
| Interquartile Range (IQR) | 5.1% | 3.9% |
| Standard Deviation (Sample) | 6.6% | 6.4% |
| Standard Deviation (Population) | 6.5% | 6.4% |
Similar Demographics by 4 or more Vehicles in Household
Demographics Similar to Costa Ricans by 4 or more Vehicles in Household
In terms of 4 or more vehicles in household, the demographic groups most similar to Costa Ricans are Burmese (6.8%, a difference of 0.11%), French American Indian (6.8%, a difference of 0.11%), Immigrants from Guatemala (6.8%, a difference of 0.13%), Comanche (6.8%, a difference of 0.36%), and Tlingit-Haida (6.8%, a difference of 0.39%).
| Demographics | Rating | Rank | 4 or more Vehicles in Household |
| Hopi | 97.0 /100 | #112 | Exceptional 6.9% |
| Canadians | 96.4 /100 | #113 | Exceptional 6.9% |
| Bolivians | 96.3 /100 | #114 | Exceptional 6.8% |
| Tlingit-Haida | 96.2 /100 | #115 | Exceptional 6.8% |
| Immigrants | Guatemala | 95.8 /100 | #116 | Exceptional 6.8% |
| Burmese | 95.7 /100 | #117 | Exceptional 6.8% |
| French American Indians | 95.7 /100 | #118 | Exceptional 6.8% |
| Costa Ricans | 95.5 /100 | #119 | Exceptional 6.8% |
| Comanche | 94.8 /100 | #120 | Exceptional 6.8% |
| Immigrants | Germany | 94.7 /100 | #121 | Exceptional 6.8% |
| Immigrants | Nicaragua | 94.7 /100 | #122 | Exceptional 6.8% |
| Immigrants | Immigrants | 94.6 /100 | #123 | Exceptional 6.8% |
| Immigrants | Asia | 94.4 /100 | #124 | Exceptional 6.8% |
| Austrians | 94.1 /100 | #125 | Exceptional 6.8% |
| Belgians | 94.1 /100 | #126 | Exceptional 6.8% |
Demographics Similar to Yugoslavians by 4 or more Vehicles in Household
In terms of 4 or more vehicles in household, the demographic groups most similar to Yugoslavians are South American Indian (6.3%, a difference of 0.050%), Syrian (6.3%, a difference of 0.090%), Immigrants from Japan (6.3%, a difference of 0.20%), Belizean (6.3%, a difference of 0.35%), and Immigrants from Burma/Myanmar (6.2%, a difference of 0.39%).
| Demographics | Rating | Rank | 4 or more Vehicles in Household |
| Lithuanians | 50.0 /100 | #174 | Average 6.3% |
| Immigrants | Western Europe | 48.8 /100 | #175 | Average 6.3% |
| Ukrainians | 47.6 /100 | #176 | Average 6.3% |
| Slovaks | 46.9 /100 | #177 | Average 6.3% |
| Belizeans | 44.5 /100 | #178 | Average 6.3% |
| Immigrants | Japan | 43.1 /100 | #179 | Average 6.3% |
| Syrians | 42.0 /100 | #180 | Average 6.3% |
| Yugoslavians | 41.1 /100 | #181 | Average 6.3% |
| South American Indians | 40.7 /100 | #182 | Average 6.3% |
| Immigrants | Burma/Myanmar | 37.5 /100 | #183 | Fair 6.2% |
| Iraqis | 37.3 /100 | #184 | Fair 6.2% |
| Thais | 36.9 /100 | #185 | Fair 6.2% |
| Immigrants | Northern Europe | 36.8 /100 | #186 | Fair 6.2% |
| Immigrants | South Africa | 35.4 /100 | #187 | Fair 6.2% |
| Kiowa | 34.7 /100 | #188 | Fair 6.2% |