Immigrants from Poland vs Delaware 4 or more Vehicles in Household
COMPARE
Immigrants from Poland
Delaware
4 or more Vehicles in Household
4 or more Vehicles in Household Comparison
Immigrants from Poland
Delaware
5.8%
4 OR MORE VEHICLES IN HOUSEHOLD
3.8/ 100
METRIC RATING
240th/ 347
METRIC RANK
7.2%
4 OR MORE VEHICLES IN HOUSEHOLD
99.6/ 100
METRIC RATING
87th/ 347
METRIC RANK
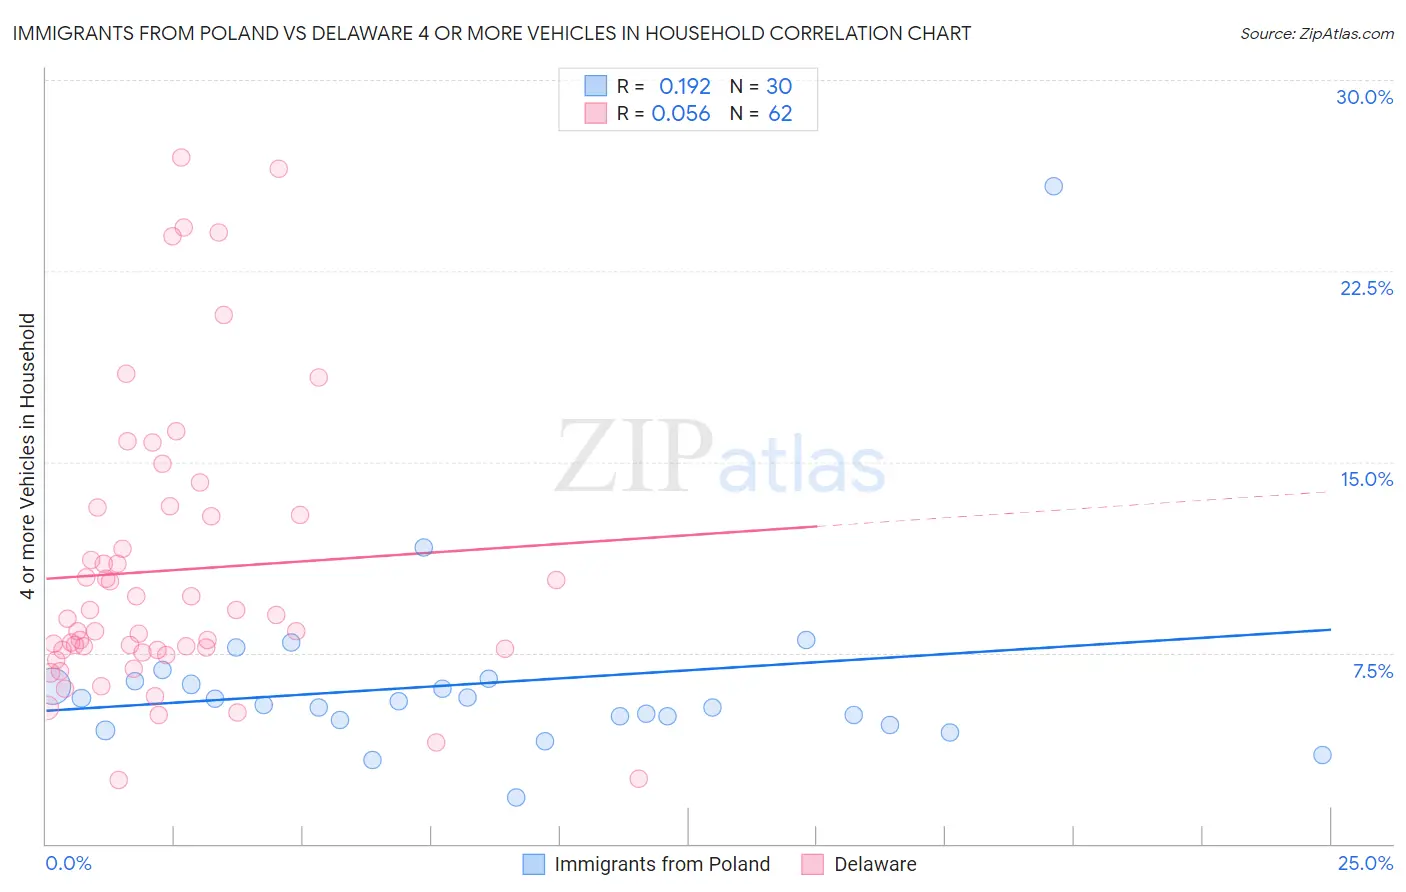
Immigrants from Poland vs Delaware 4 or more Vehicles in Household Correlation Chart
The statistical analysis conducted on geographies consisting of 303,514,746 people shows a poor positive correlation between the proportion of Immigrants from Poland and percentage of households with 4 or more vehicles available in the United States with a correlation coefficient (R) of 0.192 and weighted average of 5.8%. Similarly, the statistical analysis conducted on geographies consisting of 96,077,939 people shows a slight positive correlation between the proportion of Delaware and percentage of households with 4 or more vehicles available in the United States with a correlation coefficient (R) of 0.056 and weighted average of 7.2%, a difference of 24.4%.
4 or more Vehicles in Household Correlation Summary
| Measurement | Immigrants from Poland | Delaware |
| Minimum | 1.8% | 2.5% |
| Maximum | 25.8% | 27.0% |
| Range | 24.0% | 24.5% |
| Mean | 6.3% | 10.7% |
| Median | 5.5% | 8.6% |
| Interquartile 25% (IQ1) | 4.9% | 7.6% |
| Interquartile 75% (IQ3) | 6.4% | 12.9% |
| Interquartile Range (IQR) | 1.5% | 5.3% |
| Standard Deviation (Sample) | 4.1% | 5.7% |
| Standard Deviation (Population) | 4.0% | 5.6% |
Similar Demographics by 4 or more Vehicles in Household
Demographics Similar to Immigrants from Poland by 4 or more Vehicles in Household
In terms of 4 or more vehicles in household, the demographic groups most similar to Immigrants from Poland are Immigrants from Australia (5.8%, a difference of 0.040%), Mongolian (5.8%, a difference of 0.090%), Immigrants from Belgium (5.8%, a difference of 0.13%), Turkish (5.8%, a difference of 0.26%), and Immigrants from Middle Africa (5.8%, a difference of 0.30%).
| Demographics | Rating | Rank | 4 or more Vehicles in Household |
| Sierra Leoneans | 6.0 /100 | #233 | Tragic 5.9% |
| Africans | 4.6 /100 | #234 | Tragic 5.8% |
| Immigrants | Hungary | 4.6 /100 | #235 | Tragic 5.8% |
| Immigrants | Eritrea | 4.5 /100 | #236 | Tragic 5.8% |
| Turks | 4.1 /100 | #237 | Tragic 5.8% |
| Immigrants | Belgium | 4.0 /100 | #238 | Tragic 5.8% |
| Immigrants | Australia | 3.8 /100 | #239 | Tragic 5.8% |
| Immigrants | Poland | 3.8 /100 | #240 | Tragic 5.8% |
| Mongolians | 3.7 /100 | #241 | Tragic 5.8% |
| Immigrants | Middle Africa | 3.4 /100 | #242 | Tragic 5.8% |
| Immigrants | Czechoslovakia | 3.2 /100 | #243 | Tragic 5.8% |
| Ethiopians | 3.2 /100 | #244 | Tragic 5.8% |
| Bulgarians | 3.1 /100 | #245 | Tragic 5.8% |
| Immigrants | North Macedonia | 2.5 /100 | #246 | Tragic 5.7% |
| Immigrants | Ethiopia | 2.4 /100 | #247 | Tragic 5.7% |
Demographics Similar to Delaware by 4 or more Vehicles in Household
In terms of 4 or more vehicles in household, the demographic groups most similar to Delaware are Nonimmigrants (7.2%, a difference of 0.020%), Immigrants from Indonesia (7.2%, a difference of 0.060%), Cree (7.2%, a difference of 0.24%), British (7.2%, a difference of 0.35%), and Afghan (7.3%, a difference of 0.41%).
| Demographics | Rating | Rank | 4 or more Vehicles in Household |
| Alaska Natives | 99.8 /100 | #80 | Exceptional 7.3% |
| Finns | 99.8 /100 | #81 | Exceptional 7.3% |
| Northern Europeans | 99.8 /100 | #82 | Exceptional 7.3% |
| Potawatomi | 99.7 /100 | #83 | Exceptional 7.3% |
| Afghans | 99.7 /100 | #84 | Exceptional 7.3% |
| Cree | 99.7 /100 | #85 | Exceptional 7.2% |
| Immigrants | Indonesia | 99.6 /100 | #86 | Exceptional 7.2% |
| Delaware | 99.6 /100 | #87 | Exceptional 7.2% |
| Immigrants | Nonimmigrants | 99.6 /100 | #88 | Exceptional 7.2% |
| British | 99.6 /100 | #89 | Exceptional 7.2% |
| Creek | 99.6 /100 | #90 | Exceptional 7.2% |
| Assyrians/Chaldeans/Syriacs | 99.4 /100 | #91 | Exceptional 7.2% |
| Immigrants | Latin America | 99.4 /100 | #92 | Exceptional 7.1% |
| Immigrants | Afghanistan | 99.3 /100 | #93 | Exceptional 7.1% |
| Dutch West Indians | 99.3 /100 | #94 | Exceptional 7.1% |