Croatian vs Delaware 4 or more Vehicles in Household
COMPARE
Croatian
Delaware
4 or more Vehicles in Household
4 or more Vehicles in Household Comparison
Croatians
Delaware
6.5%
4 OR MORE VEHICLES IN HOUSEHOLD
77.8/ 100
METRIC RATING
145th/ 347
METRIC RANK
7.2%
4 OR MORE VEHICLES IN HOUSEHOLD
99.6/ 100
METRIC RATING
87th/ 347
METRIC RANK
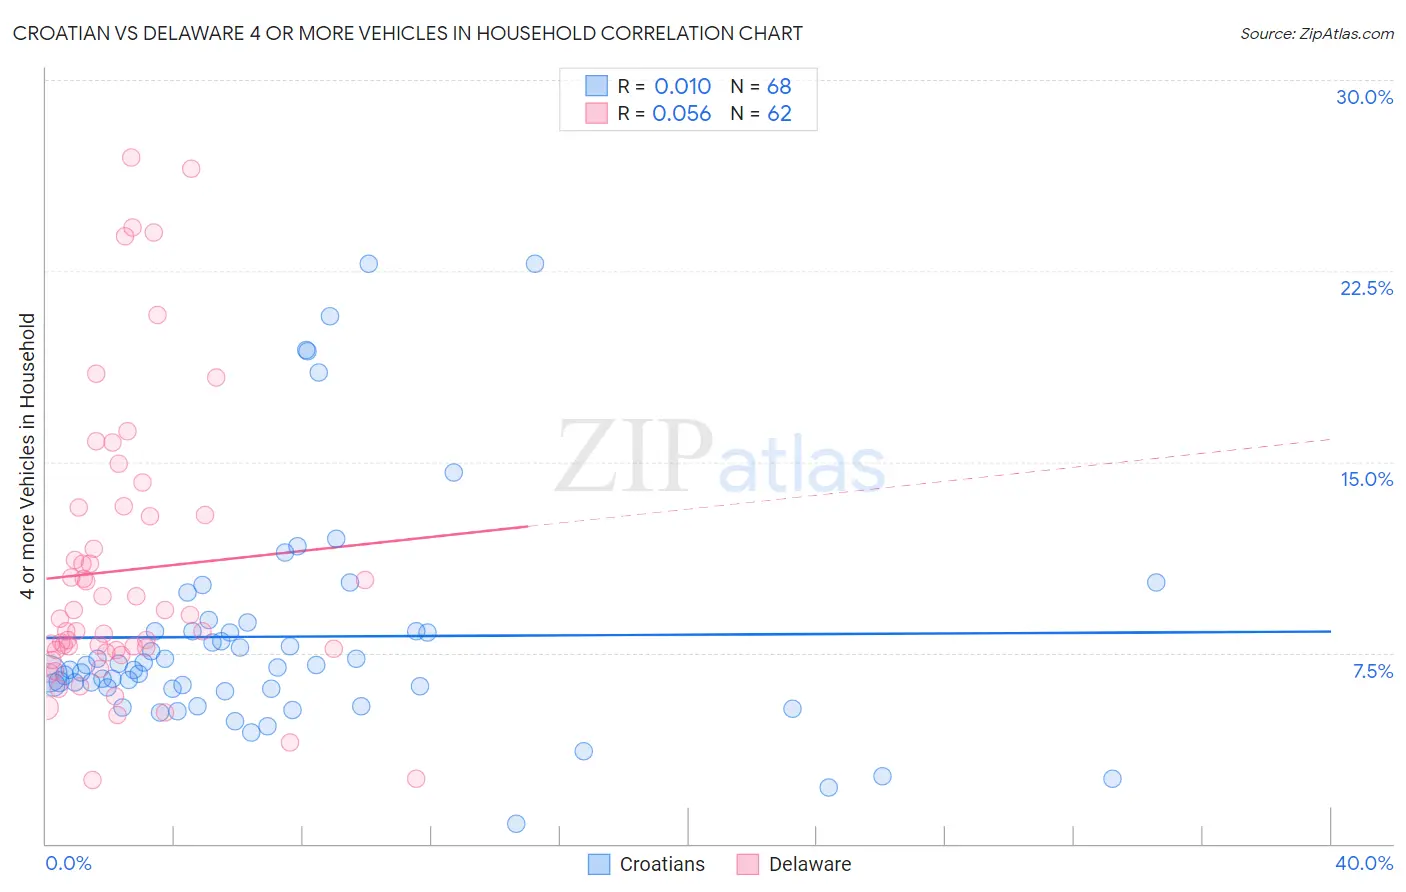
Croatian vs Delaware 4 or more Vehicles in Household Correlation Chart
The statistical analysis conducted on geographies consisting of 374,283,631 people shows no correlation between the proportion of Croatians and percentage of households with 4 or more vehicles available in the United States with a correlation coefficient (R) of 0.010 and weighted average of 6.5%. Similarly, the statistical analysis conducted on geographies consisting of 96,077,939 people shows a slight positive correlation between the proportion of Delaware and percentage of households with 4 or more vehicles available in the United States with a correlation coefficient (R) of 0.056 and weighted average of 7.2%, a difference of 10.7%.
4 or more Vehicles in Household Correlation Summary
| Measurement | Croatian | Delaware |
| Minimum | 0.78% | 2.5% |
| Maximum | 22.8% | 27.0% |
| Range | 22.0% | 24.5% |
| Mean | 8.1% | 10.7% |
| Median | 6.9% | 8.6% |
| Interquartile 25% (IQ1) | 6.1% | 7.6% |
| Interquartile 75% (IQ3) | 8.3% | 12.9% |
| Interquartile Range (IQR) | 2.3% | 5.3% |
| Standard Deviation (Sample) | 4.5% | 5.7% |
| Standard Deviation (Population) | 4.5% | 5.6% |
Similar Demographics by 4 or more Vehicles in Household
Demographics Similar to Croatians by 4 or more Vehicles in Household
In terms of 4 or more vehicles in household, the demographic groups most similar to Croatians are Immigrants from North America (6.5%, a difference of 0.10%), Immigrants from Canada (6.5%, a difference of 0.11%), Immigrants from Iraq (6.5%, a difference of 0.25%), Australian (6.6%, a difference of 0.45%), and Immigrants from Costa Rica (6.5%, a difference of 0.46%).
| Demographics | Rating | Rank | 4 or more Vehicles in Household |
| Italians | 84.5 /100 | #138 | Excellent 6.6% |
| Jordanians | 82.1 /100 | #139 | Excellent 6.6% |
| Slavs | 81.6 /100 | #140 | Excellent 6.6% |
| Australians | 80.8 /100 | #141 | Excellent 6.6% |
| Immigrants | Iraq | 79.4 /100 | #142 | Good 6.5% |
| Immigrants | Canada | 78.6 /100 | #143 | Good 6.5% |
| Immigrants | North America | 78.5 /100 | #144 | Good 6.5% |
| Croatians | 77.8 /100 | #145 | Good 6.5% |
| Immigrants | Costa Rica | 74.4 /100 | #146 | Good 6.5% |
| Immigrants | Iran | 73.9 /100 | #147 | Good 6.5% |
| Immigrants | Jordan | 73.7 /100 | #148 | Good 6.5% |
| Greeks | 73.6 /100 | #149 | Good 6.5% |
| New Zealanders | 73.3 /100 | #150 | Good 6.5% |
| Immigrants | Hong Kong | 72.2 /100 | #151 | Good 6.5% |
| Yuman | 72.1 /100 | #152 | Good 6.5% |
Demographics Similar to Delaware by 4 or more Vehicles in Household
In terms of 4 or more vehicles in household, the demographic groups most similar to Delaware are Nonimmigrants (7.2%, a difference of 0.020%), Immigrants from Indonesia (7.2%, a difference of 0.060%), Cree (7.2%, a difference of 0.24%), British (7.2%, a difference of 0.35%), and Afghan (7.3%, a difference of 0.41%).
| Demographics | Rating | Rank | 4 or more Vehicles in Household |
| Alaska Natives | 99.8 /100 | #80 | Exceptional 7.3% |
| Finns | 99.8 /100 | #81 | Exceptional 7.3% |
| Northern Europeans | 99.8 /100 | #82 | Exceptional 7.3% |
| Potawatomi | 99.7 /100 | #83 | Exceptional 7.3% |
| Afghans | 99.7 /100 | #84 | Exceptional 7.3% |
| Cree | 99.7 /100 | #85 | Exceptional 7.2% |
| Immigrants | Indonesia | 99.6 /100 | #86 | Exceptional 7.2% |
| Delaware | 99.6 /100 | #87 | Exceptional 7.2% |
| Immigrants | Nonimmigrants | 99.6 /100 | #88 | Exceptional 7.2% |
| British | 99.6 /100 | #89 | Exceptional 7.2% |
| Creek | 99.6 /100 | #90 | Exceptional 7.2% |
| Assyrians/Chaldeans/Syriacs | 99.4 /100 | #91 | Exceptional 7.2% |
| Immigrants | Latin America | 99.4 /100 | #92 | Exceptional 7.1% |
| Immigrants | Afghanistan | 99.3 /100 | #93 | Exceptional 7.1% |
| Dutch West Indians | 99.3 /100 | #94 | Exceptional 7.1% |