Celtic vs Delaware Child Poverty Under the Age of 5
COMPARE
Celtic
Delaware
Child Poverty Under the Age of 5
Child Poverty Under the Age of 5 Comparison
Celtics
Delaware
17.9%
CHILD POVERTY UNDER THE AGE OF 5
18.3/ 100
METRIC RATING
198th/ 347
METRIC RANK
18.7%
CHILD POVERTY UNDER THE AGE OF 5
3.4/ 100
METRIC RATING
218th/ 347
METRIC RANK
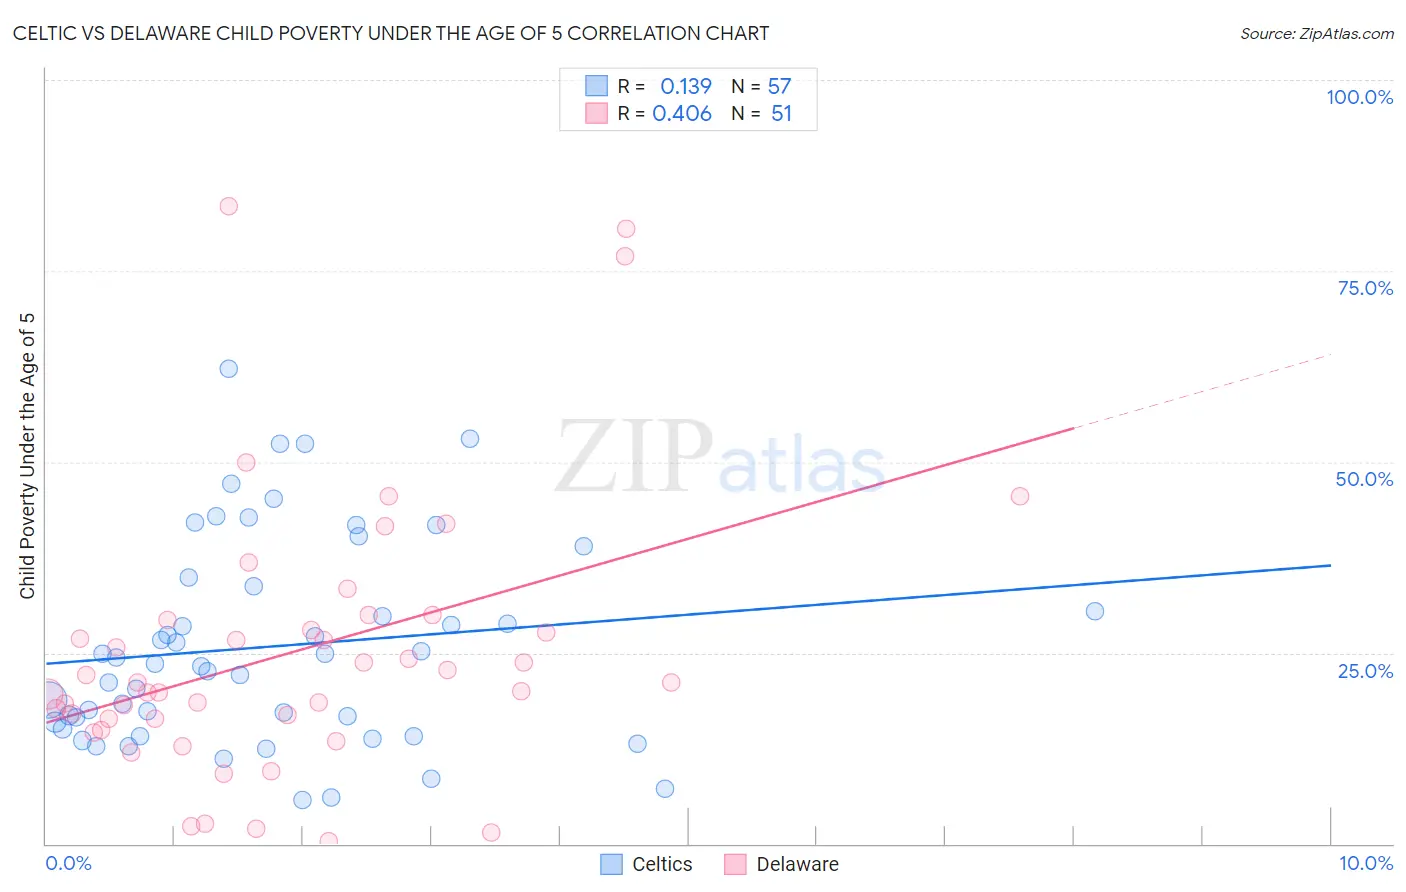
Celtic vs Delaware Child Poverty Under the Age of 5 Correlation Chart
The statistical analysis conducted on geographies consisting of 165,160,308 people shows a poor positive correlation between the proportion of Celtics and poverty level among children under the age of 5 in the United States with a correlation coefficient (R) of 0.139 and weighted average of 17.9%. Similarly, the statistical analysis conducted on geographies consisting of 94,801,216 people shows a moderate positive correlation between the proportion of Delaware and poverty level among children under the age of 5 in the United States with a correlation coefficient (R) of 0.406 and weighted average of 18.7%, a difference of 4.6%.
Child Poverty Under the Age of 5 Correlation Summary
| Measurement | Celtic | Delaware |
| Minimum | 5.7% | 0.41% |
| Maximum | 62.3% | 83.5% |
| Range | 56.5% | 83.1% |
| Mean | 25.8% | 25.0% |
| Median | 23.6% | 21.1% |
| Interquartile 25% (IQ1) | 15.5% | 16.3% |
| Interquartile 75% (IQ3) | 34.3% | 29.2% |
| Interquartile Range (IQR) | 18.8% | 12.9% |
| Standard Deviation (Sample) | 13.4% | 17.9% |
| Standard Deviation (Population) | 13.3% | 17.7% |
Demographics Similar to Celtics and Delaware by Child Poverty Under the Age of 5
In terms of child poverty under the age of 5, the demographic groups most similar to Celtics are Hungarian (17.9%, a difference of 0.010%), Iraqi (18.0%, a difference of 0.81%), Ugandan (18.0%, a difference of 0.82%), Japanese (18.1%, a difference of 0.84%), and Immigrants from Cambodia (18.1%, a difference of 0.86%). Similarly, the demographic groups most similar to Delaware are Immigrants from Africa (18.6%, a difference of 0.75%), Hmong (18.5%, a difference of 0.95%), Immigrants from Panama (18.5%, a difference of 1.4%), Malaysian (18.4%, a difference of 1.6%), and Immigrants from Thailand (18.3%, a difference of 2.4%).
| Demographics | Rating | Rank | Child Poverty Under the Age of 5 |
| Celtics | 18.3 /100 | #198 | Poor 17.9% |
| Hungarians | 18.3 /100 | #199 | Poor 17.9% |
| Iraqis | 14.0 /100 | #200 | Poor 18.0% |
| Ugandans | 13.9 /100 | #201 | Poor 18.0% |
| Japanese | 13.8 /100 | #202 | Poor 18.1% |
| Immigrants | Cambodia | 13.7 /100 | #203 | Poor 18.1% |
| Immigrants | Eastern Africa | 13.4 /100 | #204 | Poor 18.1% |
| Spaniards | 12.8 /100 | #205 | Poor 18.1% |
| Whites/Caucasians | 12.6 /100 | #206 | Poor 18.1% |
| Immigrants | Immigrants | 9.9 /100 | #207 | Tragic 18.2% |
| Scotch-Irish | 9.8 /100 | #208 | Tragic 18.2% |
| Spanish | 9.8 /100 | #209 | Tragic 18.2% |
| Panamanians | 9.7 /100 | #210 | Tragic 18.2% |
| Moroccans | 9.4 /100 | #211 | Tragic 18.2% |
| Nepalese | 8.7 /100 | #212 | Tragic 18.3% |
| Immigrants | Thailand | 8.6 /100 | #213 | Tragic 18.3% |
| Malaysians | 6.5 /100 | #214 | Tragic 18.4% |
| Immigrants | Panama | 6.0 /100 | #215 | Tragic 18.5% |
| Hmong | 5.0 /100 | #216 | Tragic 18.5% |
| Immigrants | Africa | 4.6 /100 | #217 | Tragic 18.6% |
| Delaware | 3.4 /100 | #218 | Tragic 18.7% |