Carpatho Rusyn vs Immigrants from Italy College, Under 1 year
COMPARE
Carpatho Rusyn
Immigrants from Italy
College, Under 1 year
College, Under 1 year Comparison
Carpatho Rusyns
Immigrants from Italy
67.9%
COLLEGE, UNDER 1 YEAR
96.8/ 100
METRIC RATING
103rd/ 347
METRIC RANK
66.8%
COLLEGE, UNDER 1 YEAR
86.9/ 100
METRIC RATING
138th/ 347
METRIC RANK
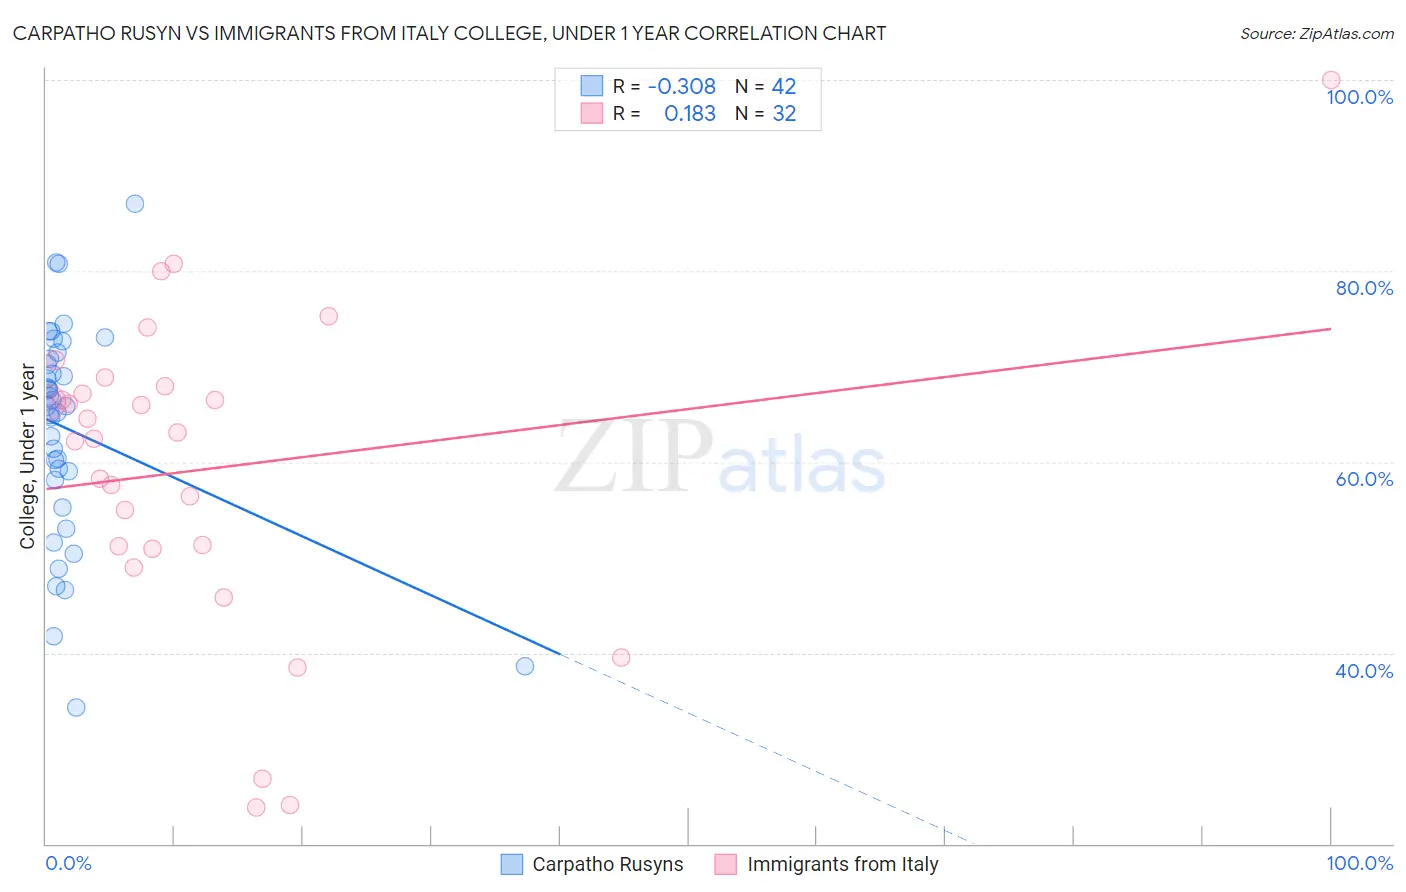
Carpatho Rusyn vs Immigrants from Italy College, Under 1 year Correlation Chart
The statistical analysis conducted on geographies consisting of 58,871,690 people shows a mild negative correlation between the proportion of Carpatho Rusyns and percentage of population with at least college, under 1 year education in the United States with a correlation coefficient (R) of -0.308 and weighted average of 67.9%. Similarly, the statistical analysis conducted on geographies consisting of 324,223,988 people shows a poor positive correlation between the proportion of Immigrants from Italy and percentage of population with at least college, under 1 year education in the United States with a correlation coefficient (R) of 0.183 and weighted average of 66.8%, a difference of 1.6%.
College, Under 1 year Correlation Summary
| Measurement | Carpatho Rusyn | Immigrants from Italy |
| Minimum | 34.2% | 23.8% |
| Maximum | 87.0% | 100.0% |
| Range | 52.8% | 76.2% |
| Mean | 63.3% | 59.2% |
| Median | 65.8% | 62.7% |
| Interquartile 25% (IQ1) | 58.1% | 51.0% |
| Interquartile 75% (IQ3) | 70.8% | 67.5% |
| Interquartile Range (IQR) | 12.7% | 16.5% |
| Standard Deviation (Sample) | 11.5% | 16.6% |
| Standard Deviation (Population) | 11.3% | 16.4% |
Similar Demographics by College, Under 1 year
Demographics Similar to Carpatho Rusyns by College, Under 1 year
In terms of college, under 1 year, the demographic groups most similar to Carpatho Rusyns are Immigrants from Eastern Europe (67.9%, a difference of 0.010%), Palestinian (67.9%, a difference of 0.010%), Immigrants from Argentina (67.9%, a difference of 0.060%), Immigrants from Bolivia (67.9%, a difference of 0.070%), and Immigrants from Western Asia (67.8%, a difference of 0.070%).
| Demographics | Rating | Rank | College, Under 1 year |
| Jordanians | 97.4 /100 | #96 | Exceptional 68.0% |
| Immigrants | Ethiopia | 97.3 /100 | #97 | Exceptional 68.0% |
| Paraguayans | 97.1 /100 | #98 | Exceptional 67.9% |
| Immigrants | Bolivia | 97.0 /100 | #99 | Exceptional 67.9% |
| Immigrants | Argentina | 97.0 /100 | #100 | Exceptional 67.9% |
| Immigrants | Eastern Europe | 96.9 /100 | #101 | Exceptional 67.9% |
| Palestinians | 96.9 /100 | #102 | Exceptional 67.9% |
| Carpatho Rusyns | 96.8 /100 | #103 | Exceptional 67.9% |
| Immigrants | Western Asia | 96.6 /100 | #104 | Exceptional 67.8% |
| Afghans | 96.6 /100 | #105 | Exceptional 67.8% |
| Immigrants | Croatia | 96.6 /100 | #106 | Exceptional 67.8% |
| Austrians | 96.4 /100 | #107 | Exceptional 67.8% |
| Immigrants | Egypt | 96.0 /100 | #108 | Exceptional 67.7% |
| Scandinavians | 95.8 /100 | #109 | Exceptional 67.7% |
| Assyrians/Chaldeans/Syriacs | 95.8 /100 | #110 | Exceptional 67.7% |
Demographics Similar to Immigrants from Italy by College, Under 1 year
In terms of college, under 1 year, the demographic groups most similar to Immigrants from Italy are Immigrants from Chile (66.8%, a difference of 0.050%), Ugandan (66.8%, a difference of 0.080%), Canadian (66.8%, a difference of 0.090%), Iraqi (66.8%, a difference of 0.10%), and Venezuelan (66.7%, a difference of 0.10%).
| Demographics | Rating | Rank | College, Under 1 year |
| Finns | 88.6 /100 | #131 | Excellent 66.9% |
| Poles | 88.4 /100 | #132 | Excellent 66.9% |
| Immigrants | Brazil | 88.3 /100 | #133 | Excellent 66.9% |
| Iraqis | 88.0 /100 | #134 | Excellent 66.8% |
| Canadians | 87.9 /100 | #135 | Excellent 66.8% |
| Ugandans | 87.8 /100 | #136 | Excellent 66.8% |
| Immigrants | Chile | 87.4 /100 | #137 | Excellent 66.8% |
| Immigrants | Italy | 86.9 /100 | #138 | Excellent 66.8% |
| Venezuelans | 85.9 /100 | #139 | Excellent 66.7% |
| Slavs | 85.9 /100 | #140 | Excellent 66.7% |
| Immigrants | Afghanistan | 85.1 /100 | #141 | Excellent 66.7% |
| English | 82.9 /100 | #142 | Excellent 66.6% |
| Immigrants | Uganda | 82.8 /100 | #143 | Excellent 66.5% |
| Immigrants | Germany | 82.0 /100 | #144 | Excellent 66.5% |
| Immigrants | Kenya | 81.8 /100 | #145 | Excellent 66.5% |