Bulgarian vs Ecuadorian 4 or more Vehicles in Household
COMPARE
Bulgarian
Ecuadorian
4 or more Vehicles in Household
4 or more Vehicles in Household Comparison
Bulgarians
Ecuadorians
5.8%
4 OR MORE VEHICLES IN HOUSEHOLD
3.1/ 100
METRIC RATING
245th/ 347
METRIC RANK
4.5%
4 OR MORE VEHICLES IN HOUSEHOLD
0.0/ 100
METRIC RATING
321st/ 347
METRIC RANK
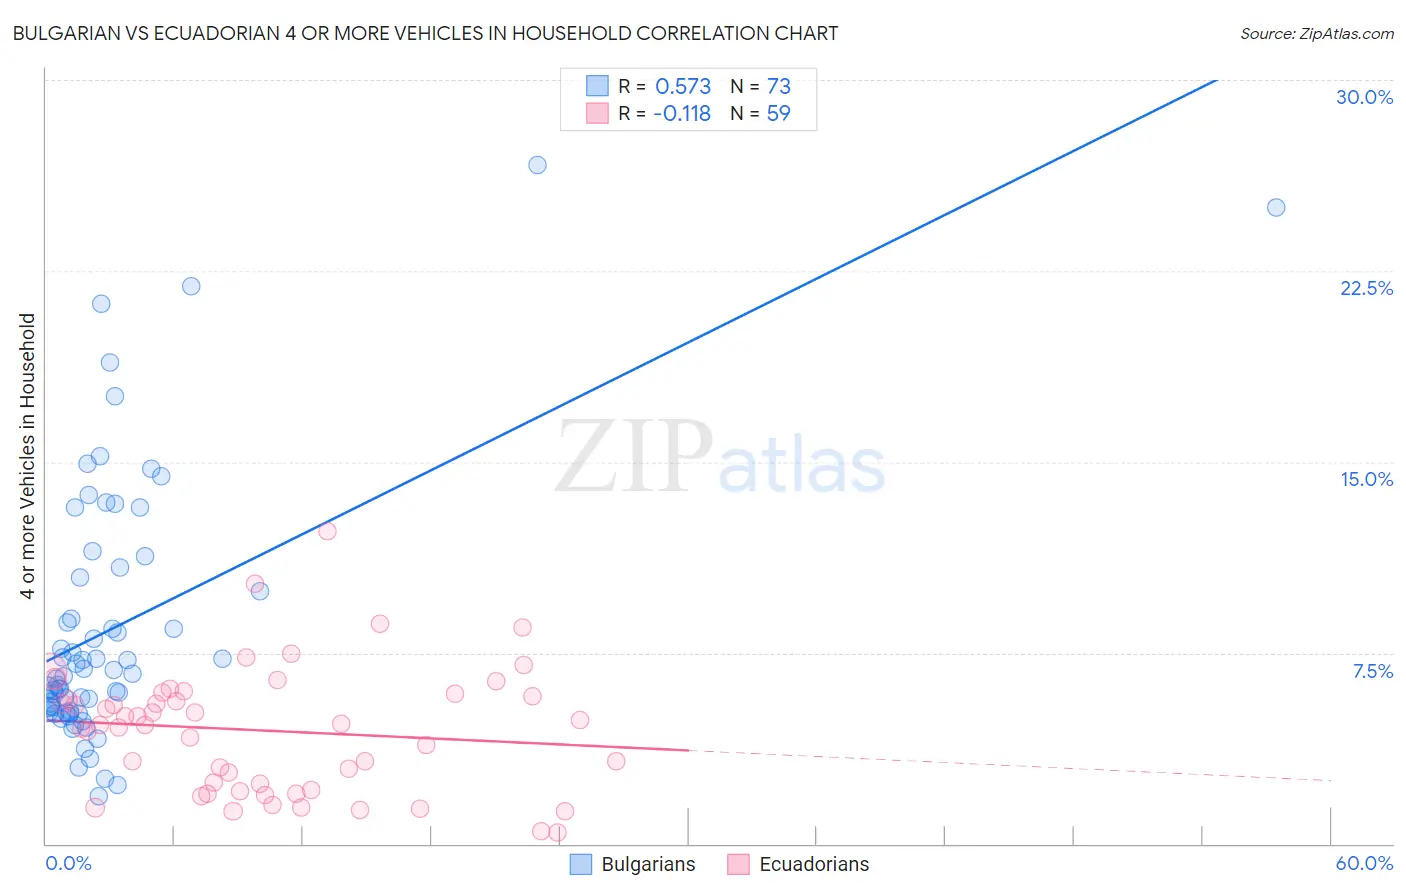
Bulgarian vs Ecuadorian 4 or more Vehicles in Household Correlation Chart
The statistical analysis conducted on geographies consisting of 205,001,744 people shows a substantial positive correlation between the proportion of Bulgarians and percentage of households with 4 or more vehicles available in the United States with a correlation coefficient (R) of 0.573 and weighted average of 5.8%. Similarly, the statistical analysis conducted on geographies consisting of 316,107,100 people shows a poor negative correlation between the proportion of Ecuadorians and percentage of households with 4 or more vehicles available in the United States with a correlation coefficient (R) of -0.118 and weighted average of 4.5%, a difference of 29.4%.
4 or more Vehicles in Household Correlation Summary
| Measurement | Bulgarian | Ecuadorian |
| Minimum | 1.9% | 0.44% |
| Maximum | 26.7% | 12.3% |
| Range | 24.8% | 11.9% |
| Mean | 8.5% | 4.4% |
| Median | 6.7% | 4.7% |
| Interquartile 25% (IQ1) | 5.2% | 2.1% |
| Interquartile 75% (IQ3) | 10.6% | 5.9% |
| Interquartile Range (IQR) | 5.5% | 3.8% |
| Standard Deviation (Sample) | 5.2% | 2.4% |
| Standard Deviation (Population) | 5.2% | 2.4% |
Similar Demographics by 4 or more Vehicles in Household
Demographics Similar to Bulgarians by 4 or more Vehicles in Household
In terms of 4 or more vehicles in household, the demographic groups most similar to Bulgarians are Ethiopian (5.8%, a difference of 0.040%), Immigrants from Czechoslovakia (5.8%, a difference of 0.050%), Immigrants from Middle Africa (5.8%, a difference of 0.24%), Mongolian (5.8%, a difference of 0.45%), and Immigrants from Poland (5.8%, a difference of 0.54%).
| Demographics | Rating | Rank | 4 or more Vehicles in Household |
| Immigrants | Belgium | 4.0 /100 | #238 | Tragic 5.8% |
| Immigrants | Australia | 3.8 /100 | #239 | Tragic 5.8% |
| Immigrants | Poland | 3.8 /100 | #240 | Tragic 5.8% |
| Mongolians | 3.7 /100 | #241 | Tragic 5.8% |
| Immigrants | Middle Africa | 3.4 /100 | #242 | Tragic 5.8% |
| Immigrants | Czechoslovakia | 3.2 /100 | #243 | Tragic 5.8% |
| Ethiopians | 3.2 /100 | #244 | Tragic 5.8% |
| Bulgarians | 3.1 /100 | #245 | Tragic 5.8% |
| Immigrants | North Macedonia | 2.5 /100 | #246 | Tragic 5.7% |
| Immigrants | Ethiopia | 2.4 /100 | #247 | Tragic 5.7% |
| Immigrants | Eastern Africa | 2.4 /100 | #248 | Tragic 5.7% |
| Immigrants | Southern Europe | 2.3 /100 | #249 | Tragic 5.7% |
| Immigrants | Europe | 2.3 /100 | #250 | Tragic 5.7% |
| Ugandans | 2.2 /100 | #251 | Tragic 5.7% |
| Sub-Saharan Africans | 2.1 /100 | #252 | Tragic 5.7% |
Demographics Similar to Ecuadorians by 4 or more Vehicles in Household
In terms of 4 or more vehicles in household, the demographic groups most similar to Ecuadorians are Immigrants from Yemen (4.5%, a difference of 0.17%), Immigrants from Caribbean (4.4%, a difference of 0.58%), Immigrants from Haiti (4.5%, a difference of 0.75%), Soviet Union (4.4%, a difference of 0.86%), and Immigrants from Jamaica (4.4%, a difference of 1.2%).
| Demographics | Rating | Rank | 4 or more Vehicles in Household |
| Immigrants | West Indies | 0.0 /100 | #314 | Tragic 4.7% |
| Immigrants | Belarus | 0.0 /100 | #315 | Tragic 4.7% |
| Puerto Ricans | 0.0 /100 | #316 | Tragic 4.7% |
| U.S. Virgin Islanders | 0.0 /100 | #317 | Tragic 4.6% |
| Jamaicans | 0.0 /100 | #318 | Tragic 4.6% |
| Haitians | 0.0 /100 | #319 | Tragic 4.6% |
| Immigrants | Haiti | 0.0 /100 | #320 | Tragic 4.5% |
| Ecuadorians | 0.0 /100 | #321 | Tragic 4.5% |
| Immigrants | Yemen | 0.0 /100 | #322 | Tragic 4.5% |
| Immigrants | Caribbean | 0.0 /100 | #323 | Tragic 4.4% |
| Soviet Union | 0.0 /100 | #324 | Tragic 4.4% |
| Immigrants | Jamaica | 0.0 /100 | #325 | Tragic 4.4% |
| Cape Verdeans | 0.0 /100 | #326 | Tragic 4.4% |
| Senegalese | 0.0 /100 | #327 | Tragic 4.3% |
| Trinidadians and Tobagonians | 0.0 /100 | #328 | Tragic 4.3% |