Immigrants from South Central Asia vs Ecuadorian 4 or more Vehicles in Household
COMPARE
Immigrants from South Central Asia
Ecuadorian
4 or more Vehicles in Household
4 or more Vehicles in Household Comparison
Immigrants from South Central Asia
Ecuadorians
6.1%
4 OR MORE VEHICLES IN HOUSEHOLD
21.3/ 100
METRIC RATING
202nd/ 347
METRIC RANK
4.5%
4 OR MORE VEHICLES IN HOUSEHOLD
0.0/ 100
METRIC RATING
321st/ 347
METRIC RANK
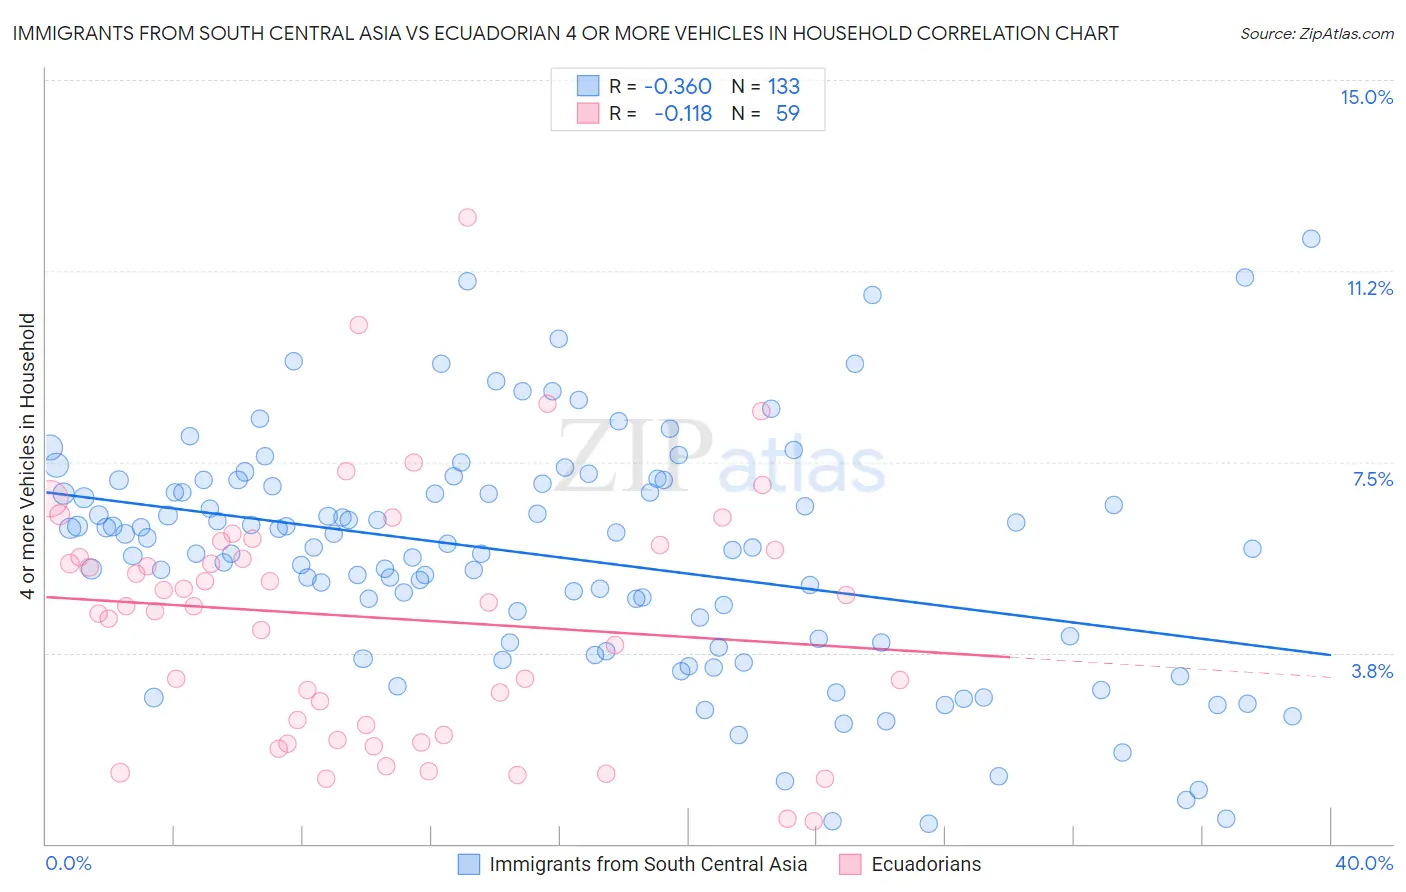
Immigrants from South Central Asia vs Ecuadorian 4 or more Vehicles in Household Correlation Chart
The statistical analysis conducted on geographies consisting of 470,551,958 people shows a mild negative correlation between the proportion of Immigrants from South Central Asia and percentage of households with 4 or more vehicles available in the United States with a correlation coefficient (R) of -0.360 and weighted average of 6.1%. Similarly, the statistical analysis conducted on geographies consisting of 316,107,100 people shows a poor negative correlation between the proportion of Ecuadorians and percentage of households with 4 or more vehicles available in the United States with a correlation coefficient (R) of -0.118 and weighted average of 4.5%, a difference of 37.0%.
4 or more Vehicles in Household Correlation Summary
| Measurement | Immigrants from South Central Asia | Ecuadorian |
| Minimum | 0.38% | 0.44% |
| Maximum | 11.9% | 12.3% |
| Range | 11.5% | 11.9% |
| Mean | 5.6% | 4.4% |
| Median | 5.8% | 4.7% |
| Interquartile 25% (IQ1) | 4.0% | 2.1% |
| Interquartile 75% (IQ3) | 7.0% | 5.9% |
| Interquartile Range (IQR) | 3.1% | 3.8% |
| Standard Deviation (Sample) | 2.3% | 2.4% |
| Standard Deviation (Population) | 2.3% | 2.4% |
Similar Demographics by 4 or more Vehicles in Household
Demographics Similar to Immigrants from South Central Asia by 4 or more Vehicles in Household
In terms of 4 or more vehicles in household, the demographic groups most similar to Immigrants from South Central Asia are Egyptian (6.1%, a difference of 0.010%), Latvian (6.1%, a difference of 0.060%), Immigrants from Norway (6.1%, a difference of 0.070%), Immigrants from Sierra Leone (6.1%, a difference of 0.14%), and Immigrants from Portugal (6.1%, a difference of 0.15%).
| Demographics | Rating | Rank | 4 or more Vehicles in Household |
| Argentineans | 27.0 /100 | #195 | Fair 6.2% |
| Tsimshian | 26.4 /100 | #196 | Fair 6.2% |
| Immigrants | Sri Lanka | 23.7 /100 | #197 | Fair 6.1% |
| Immigrants | Portugal | 22.3 /100 | #198 | Fair 6.1% |
| Immigrants | Norway | 21.8 /100 | #199 | Fair 6.1% |
| Latvians | 21.7 /100 | #200 | Fair 6.1% |
| Egyptians | 21.4 /100 | #201 | Fair 6.1% |
| Immigrants | South Central Asia | 21.3 /100 | #202 | Fair 6.1% |
| Immigrants | Sierra Leone | 20.5 /100 | #203 | Fair 6.1% |
| Immigrants | Belize | 19.8 /100 | #204 | Poor 6.1% |
| Hondurans | 19.3 /100 | #205 | Poor 6.1% |
| Kenyans | 18.5 /100 | #206 | Poor 6.1% |
| Immigrants | Chile | 16.9 /100 | #207 | Poor 6.1% |
| Immigrants | Nigeria | 15.6 /100 | #208 | Poor 6.1% |
| Immigrants | Honduras | 15.4 /100 | #209 | Poor 6.1% |
Demographics Similar to Ecuadorians by 4 or more Vehicles in Household
In terms of 4 or more vehicles in household, the demographic groups most similar to Ecuadorians are Immigrants from Yemen (4.5%, a difference of 0.17%), Immigrants from Caribbean (4.4%, a difference of 0.58%), Immigrants from Haiti (4.5%, a difference of 0.75%), Soviet Union (4.4%, a difference of 0.86%), and Immigrants from Jamaica (4.4%, a difference of 1.2%).
| Demographics | Rating | Rank | 4 or more Vehicles in Household |
| Immigrants | West Indies | 0.0 /100 | #314 | Tragic 4.7% |
| Immigrants | Belarus | 0.0 /100 | #315 | Tragic 4.7% |
| Puerto Ricans | 0.0 /100 | #316 | Tragic 4.7% |
| U.S. Virgin Islanders | 0.0 /100 | #317 | Tragic 4.6% |
| Jamaicans | 0.0 /100 | #318 | Tragic 4.6% |
| Haitians | 0.0 /100 | #319 | Tragic 4.6% |
| Immigrants | Haiti | 0.0 /100 | #320 | Tragic 4.5% |
| Ecuadorians | 0.0 /100 | #321 | Tragic 4.5% |
| Immigrants | Yemen | 0.0 /100 | #322 | Tragic 4.5% |
| Immigrants | Caribbean | 0.0 /100 | #323 | Tragic 4.4% |
| Soviet Union | 0.0 /100 | #324 | Tragic 4.4% |
| Immigrants | Jamaica | 0.0 /100 | #325 | Tragic 4.4% |
| Cape Verdeans | 0.0 /100 | #326 | Tragic 4.4% |
| Senegalese | 0.0 /100 | #327 | Tragic 4.3% |
| Trinidadians and Tobagonians | 0.0 /100 | #328 | Tragic 4.3% |