Bulgarian vs Immigrants from Germany 4 or more Vehicles in Household
COMPARE
Bulgarian
Immigrants from Germany
4 or more Vehicles in Household
4 or more Vehicles in Household Comparison
Bulgarians
Immigrants from Germany
5.8%
4 OR MORE VEHICLES IN HOUSEHOLD
3.1/ 100
METRIC RATING
245th/ 347
METRIC RANK
6.8%
4 OR MORE VEHICLES IN HOUSEHOLD
94.7/ 100
METRIC RATING
121st/ 347
METRIC RANK
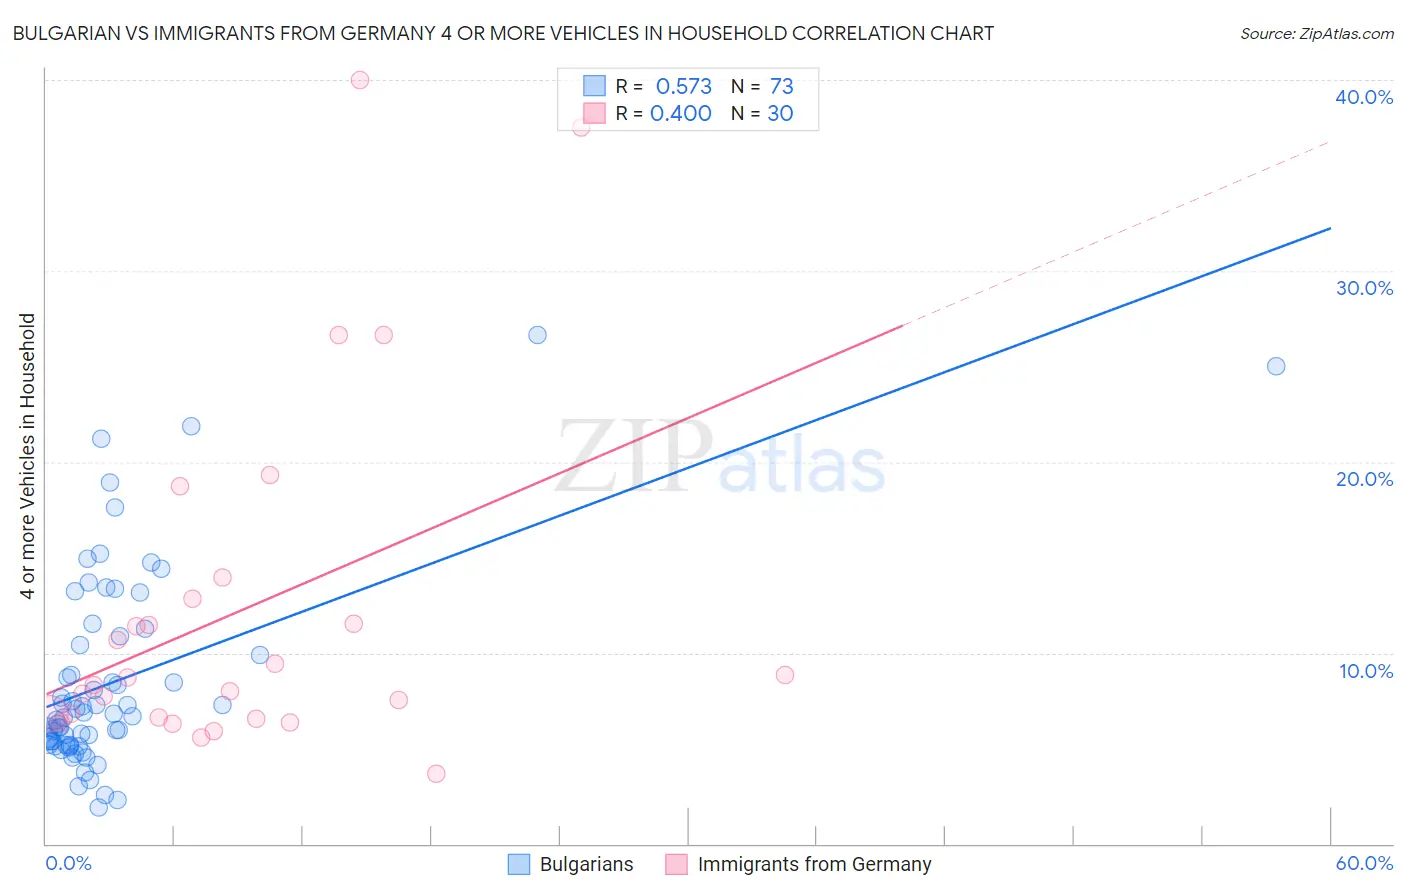
Bulgarian vs Immigrants from Germany 4 or more Vehicles in Household Correlation Chart
The statistical analysis conducted on geographies consisting of 205,001,744 people shows a substantial positive correlation between the proportion of Bulgarians and percentage of households with 4 or more vehicles available in the United States with a correlation coefficient (R) of 0.573 and weighted average of 5.8%. Similarly, the statistical analysis conducted on geographies consisting of 462,058,551 people shows a mild positive correlation between the proportion of Immigrants from Germany and percentage of households with 4 or more vehicles available in the United States with a correlation coefficient (R) of 0.400 and weighted average of 6.8%, a difference of 17.5%.
4 or more Vehicles in Household Correlation Summary
| Measurement | Bulgarian | Immigrants from Germany |
| Minimum | 1.9% | 3.7% |
| Maximum | 26.7% | 40.0% |
| Range | 24.8% | 36.3% |
| Mean | 8.5% | 12.3% |
| Median | 6.7% | 8.5% |
| Interquartile 25% (IQ1) | 5.2% | 6.6% |
| Interquartile 75% (IQ3) | 10.6% | 12.8% |
| Interquartile Range (IQR) | 5.5% | 6.2% |
| Standard Deviation (Sample) | 5.2% | 9.2% |
| Standard Deviation (Population) | 5.2% | 9.0% |
Similar Demographics by 4 or more Vehicles in Household
Demographics Similar to Bulgarians by 4 or more Vehicles in Household
In terms of 4 or more vehicles in household, the demographic groups most similar to Bulgarians are Ethiopian (5.8%, a difference of 0.040%), Immigrants from Czechoslovakia (5.8%, a difference of 0.050%), Immigrants from Middle Africa (5.8%, a difference of 0.24%), Mongolian (5.8%, a difference of 0.45%), and Immigrants from Poland (5.8%, a difference of 0.54%).
| Demographics | Rating | Rank | 4 or more Vehicles in Household |
| Immigrants | Belgium | 4.0 /100 | #238 | Tragic 5.8% |
| Immigrants | Australia | 3.8 /100 | #239 | Tragic 5.8% |
| Immigrants | Poland | 3.8 /100 | #240 | Tragic 5.8% |
| Mongolians | 3.7 /100 | #241 | Tragic 5.8% |
| Immigrants | Middle Africa | 3.4 /100 | #242 | Tragic 5.8% |
| Immigrants | Czechoslovakia | 3.2 /100 | #243 | Tragic 5.8% |
| Ethiopians | 3.2 /100 | #244 | Tragic 5.8% |
| Bulgarians | 3.1 /100 | #245 | Tragic 5.8% |
| Immigrants | North Macedonia | 2.5 /100 | #246 | Tragic 5.7% |
| Immigrants | Ethiopia | 2.4 /100 | #247 | Tragic 5.7% |
| Immigrants | Eastern Africa | 2.4 /100 | #248 | Tragic 5.7% |
| Immigrants | Southern Europe | 2.3 /100 | #249 | Tragic 5.7% |
| Immigrants | Europe | 2.3 /100 | #250 | Tragic 5.7% |
| Ugandans | 2.2 /100 | #251 | Tragic 5.7% |
| Sub-Saharan Africans | 2.1 /100 | #252 | Tragic 5.7% |
Demographics Similar to Immigrants from Germany by 4 or more Vehicles in Household
In terms of 4 or more vehicles in household, the demographic groups most similar to Immigrants from Germany are Immigrants from Nicaragua (6.8%, a difference of 0.0%), Comanche (6.8%, a difference of 0.060%), Immigrants (6.8%, a difference of 0.070%), Immigrants from Asia (6.8%, a difference of 0.16%), and Austrian (6.8%, a difference of 0.26%).
| Demographics | Rating | Rank | 4 or more Vehicles in Household |
| Bolivians | 96.3 /100 | #114 | Exceptional 6.8% |
| Tlingit-Haida | 96.2 /100 | #115 | Exceptional 6.8% |
| Immigrants | Guatemala | 95.8 /100 | #116 | Exceptional 6.8% |
| Burmese | 95.7 /100 | #117 | Exceptional 6.8% |
| French American Indians | 95.7 /100 | #118 | Exceptional 6.8% |
| Costa Ricans | 95.5 /100 | #119 | Exceptional 6.8% |
| Comanche | 94.8 /100 | #120 | Exceptional 6.8% |
| Immigrants | Germany | 94.7 /100 | #121 | Exceptional 6.8% |
| Immigrants | Nicaragua | 94.7 /100 | #122 | Exceptional 6.8% |
| Immigrants | Immigrants | 94.6 /100 | #123 | Exceptional 6.8% |
| Immigrants | Asia | 94.4 /100 | #124 | Exceptional 6.8% |
| Austrians | 94.1 /100 | #125 | Exceptional 6.8% |
| Belgians | 94.1 /100 | #126 | Exceptional 6.8% |
| Immigrants | Korea | 93.8 /100 | #127 | Exceptional 6.8% |
| Immigrants | Bolivia | 92.5 /100 | #128 | Exceptional 6.7% |