Bulgarian vs Ecuadorian Single Father Households
COMPARE
Bulgarian
Ecuadorian
Single Father Households
Single Father Households Comparison
Bulgarians
Ecuadorians
2.0%
SINGLE FATHER HOUSEHOLDS
100.0/ 100
METRIC RATING
29th/ 347
METRIC RANK
2.4%
SINGLE FATHER HOUSEHOLDS
24.5/ 100
METRIC RATING
204th/ 347
METRIC RANK
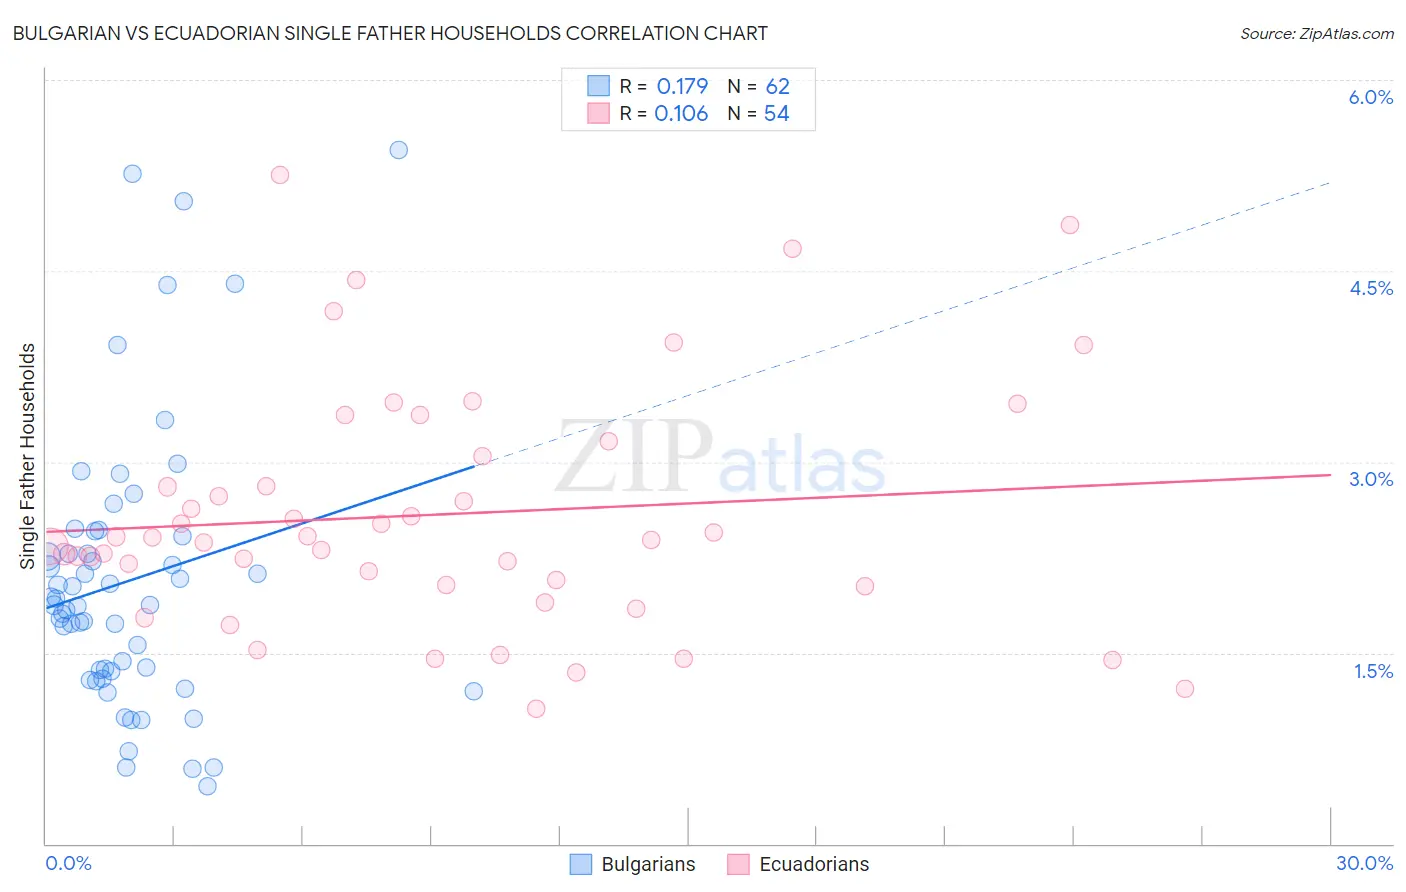
Bulgarian vs Ecuadorian Single Father Households Correlation Chart
The statistical analysis conducted on geographies consisting of 204,652,646 people shows a poor positive correlation between the proportion of Bulgarians and percentage of single father households in the United States with a correlation coefficient (R) of 0.179 and weighted average of 2.0%. Similarly, the statistical analysis conducted on geographies consisting of 315,595,316 people shows a poor positive correlation between the proportion of Ecuadorians and percentage of single father households in the United States with a correlation coefficient (R) of 0.106 and weighted average of 2.4%, a difference of 21.1%.
Single Father Households Correlation Summary
| Measurement | Bulgarian | Ecuadorian |
| Minimum | 0.45% | 1.1% |
| Maximum | 5.5% | 5.3% |
| Range | 5.0% | 4.2% |
| Mean | 2.1% | 2.6% |
| Median | 1.9% | 2.4% |
| Interquartile 25% (IQ1) | 1.4% | 2.0% |
| Interquartile 75% (IQ3) | 2.4% | 3.0% |
| Interquartile Range (IQR) | 1.1% | 1.0% |
| Standard Deviation (Sample) | 1.1% | 0.94% |
| Standard Deviation (Population) | 1.1% | 0.93% |
Similar Demographics by Single Father Households
Demographics Similar to Bulgarians by Single Father Households
In terms of single father households, the demographic groups most similar to Bulgarians are Cambodian (2.0%, a difference of 0.020%), Israeli (2.0%, a difference of 0.050%), Immigrants from Japan (2.0%, a difference of 0.090%), Chinese (2.0%, a difference of 0.090%), and Immigrants from South Central Asia (2.0%, a difference of 0.27%).
| Demographics | Rating | Rank | Single Father Households |
| Immigrants | Latvia | 100.0 /100 | #22 | Exceptional 1.9% |
| Immigrants | Croatia | 100.0 /100 | #23 | Exceptional 2.0% |
| Immigrants | Russia | 100.0 /100 | #24 | Exceptional 2.0% |
| Eastern Europeans | 100.0 /100 | #25 | Exceptional 2.0% |
| Assyrians/Chaldeans/Syriacs | 100.0 /100 | #26 | Exceptional 2.0% |
| Immigrants | South Central Asia | 100.0 /100 | #27 | Exceptional 2.0% |
| Immigrants | Japan | 100.0 /100 | #28 | Exceptional 2.0% |
| Bulgarians | 100.0 /100 | #29 | Exceptional 2.0% |
| Cambodians | 100.0 /100 | #30 | Exceptional 2.0% |
| Israelis | 100.0 /100 | #31 | Exceptional 2.0% |
| Chinese | 100.0 /100 | #32 | Exceptional 2.0% |
| Turks | 100.0 /100 | #33 | Exceptional 2.0% |
| Immigrants | Australia | 100.0 /100 | #34 | Exceptional 2.0% |
| Albanians | 100.0 /100 | #35 | Exceptional 2.0% |
| Immigrants | Belgium | 100.0 /100 | #36 | Exceptional 2.0% |
Demographics Similar to Ecuadorians by Single Father Households
In terms of single father households, the demographic groups most similar to Ecuadorians are French Canadian (2.4%, a difference of 0.020%), Immigrants from Afghanistan (2.4%, a difference of 0.030%), Korean (2.4%, a difference of 0.030%), German Russian (2.4%, a difference of 0.12%), and Immigrants from Uganda (2.4%, a difference of 0.15%).
| Demographics | Rating | Rank | Single Father Households |
| Germans | 28.0 /100 | #197 | Fair 2.4% |
| Scandinavians | 27.4 /100 | #198 | Fair 2.4% |
| Immigrants | Vietnam | 27.1 /100 | #199 | Fair 2.4% |
| Peruvians | 27.1 /100 | #200 | Fair 2.4% |
| Immigrants | Uganda | 26.0 /100 | #201 | Fair 2.4% |
| German Russians | 25.7 /100 | #202 | Fair 2.4% |
| French Canadians | 24.7 /100 | #203 | Fair 2.4% |
| Ecuadorians | 24.5 /100 | #204 | Fair 2.4% |
| Immigrants | Afghanistan | 24.2 /100 | #205 | Fair 2.4% |
| Koreans | 24.1 /100 | #206 | Fair 2.4% |
| Whites/Caucasians | 22.6 /100 | #207 | Fair 2.4% |
| Immigrants | Kenya | 20.3 /100 | #208 | Fair 2.4% |
| Immigrants | Peru | 19.3 /100 | #209 | Poor 2.4% |
| Immigrants | Costa Rica | 19.2 /100 | #210 | Poor 2.4% |
| Immigrants | Nigeria | 18.7 /100 | #211 | Poor 2.4% |