Immigrants from Uganda vs Ecuadorian 4 or more Vehicles in Household
COMPARE
Immigrants from Uganda
Ecuadorian
4 or more Vehicles in Household
4 or more Vehicles in Household Comparison
Immigrants from Uganda
Ecuadorians
5.9%
4 OR MORE VEHICLES IN HOUSEHOLD
7.5/ 100
METRIC RATING
228th/ 347
METRIC RANK
4.5%
4 OR MORE VEHICLES IN HOUSEHOLD
0.0/ 100
METRIC RATING
321st/ 347
METRIC RANK
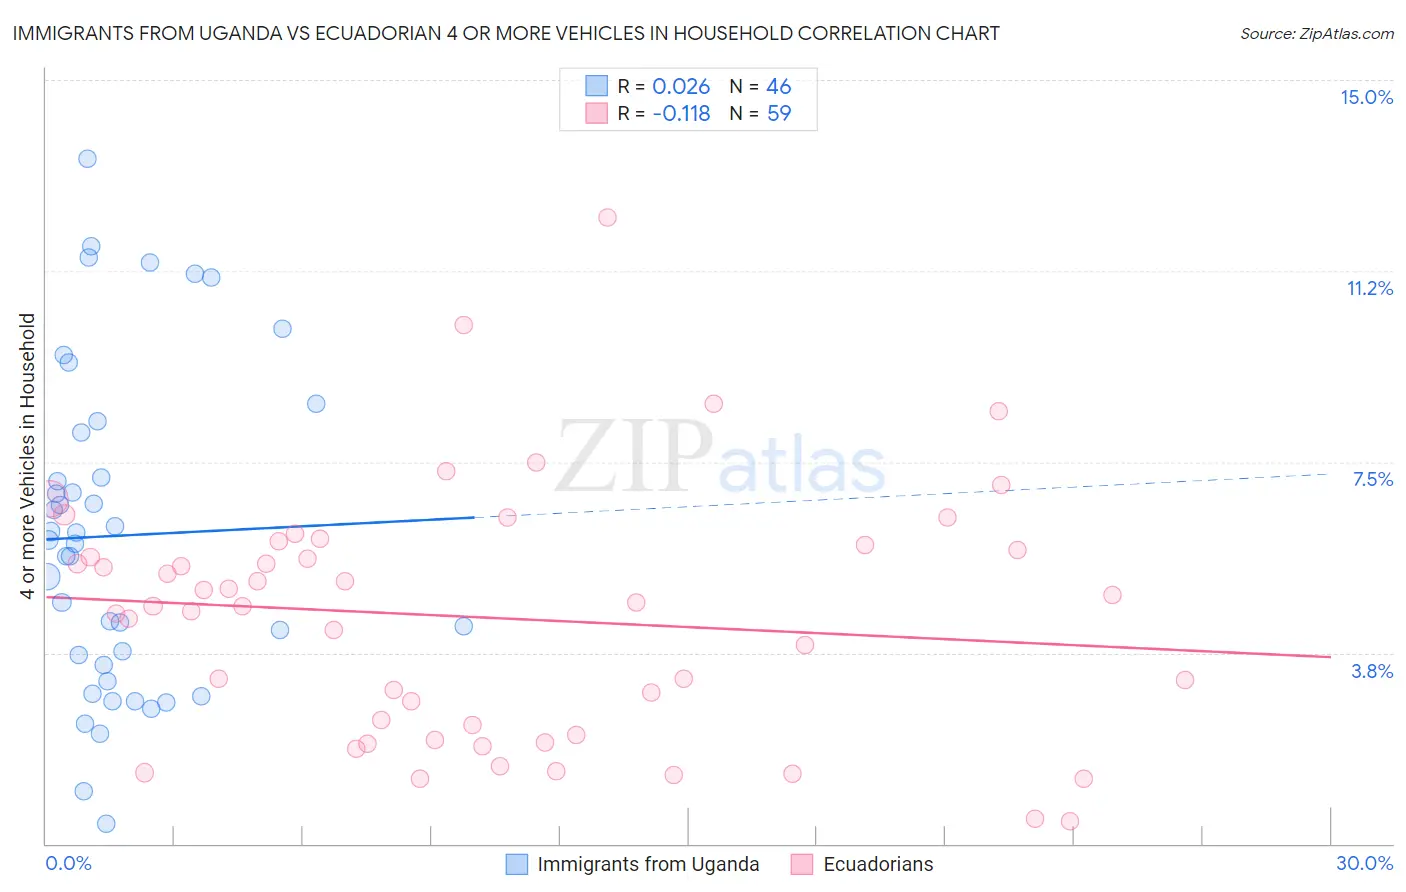
Immigrants from Uganda vs Ecuadorian 4 or more Vehicles in Household Correlation Chart
The statistical analysis conducted on geographies consisting of 125,864,473 people shows no correlation between the proportion of Immigrants from Uganda and percentage of households with 4 or more vehicles available in the United States with a correlation coefficient (R) of 0.026 and weighted average of 5.9%. Similarly, the statistical analysis conducted on geographies consisting of 316,107,100 people shows a poor negative correlation between the proportion of Ecuadorians and percentage of households with 4 or more vehicles available in the United States with a correlation coefficient (R) of -0.118 and weighted average of 4.5%, a difference of 32.7%.
4 or more Vehicles in Household Correlation Summary
| Measurement | Immigrants from Uganda | Ecuadorian |
| Minimum | 0.38% | 0.44% |
| Maximum | 13.5% | 12.3% |
| Range | 13.1% | 11.9% |
| Mean | 6.1% | 4.4% |
| Median | 5.9% | 4.7% |
| Interquartile 25% (IQ1) | 3.5% | 2.1% |
| Interquartile 75% (IQ3) | 8.1% | 5.9% |
| Interquartile Range (IQR) | 4.6% | 3.8% |
| Standard Deviation (Sample) | 3.2% | 2.4% |
| Standard Deviation (Population) | 3.1% | 2.4% |
Similar Demographics by 4 or more Vehicles in Household
Demographics Similar to Immigrants from Uganda by 4 or more Vehicles in Household
In terms of 4 or more vehicles in household, the demographic groups most similar to Immigrants from Uganda are Immigrants from Western Asia (5.9%, a difference of 0.090%), Immigrants from Singapore (5.9%, a difference of 0.13%), Eastern European (5.9%, a difference of 0.28%), Immigrants from Malaysia (5.9%, a difference of 0.35%), and Immigrants from Switzerland (5.9%, a difference of 0.47%).
| Demographics | Rating | Rank | 4 or more Vehicles in Household |
| Immigrants | Moldova | 9.3 /100 | #221 | Tragic 6.0% |
| Cajuns | 9.2 /100 | #222 | Tragic 6.0% |
| Immigrants | Kenya | 9.2 /100 | #223 | Tragic 6.0% |
| Cubans | 9.2 /100 | #224 | Tragic 6.0% |
| Indonesians | 8.9 /100 | #225 | Tragic 6.0% |
| Immigrants | Singapore | 7.9 /100 | #226 | Tragic 5.9% |
| Immigrants | Western Asia | 7.8 /100 | #227 | Tragic 5.9% |
| Immigrants | Uganda | 7.5 /100 | #228 | Tragic 5.9% |
| Eastern Europeans | 6.8 /100 | #229 | Tragic 5.9% |
| Immigrants | Malaysia | 6.7 /100 | #230 | Tragic 5.9% |
| Immigrants | Switzerland | 6.4 /100 | #231 | Tragic 5.9% |
| Immigrants | Argentina | 6.0 /100 | #232 | Tragic 5.9% |
| Sierra Leoneans | 6.0 /100 | #233 | Tragic 5.9% |
| Africans | 4.6 /100 | #234 | Tragic 5.8% |
| Immigrants | Hungary | 4.6 /100 | #235 | Tragic 5.8% |
Demographics Similar to Ecuadorians by 4 or more Vehicles in Household
In terms of 4 or more vehicles in household, the demographic groups most similar to Ecuadorians are Immigrants from Yemen (4.5%, a difference of 0.17%), Immigrants from Caribbean (4.4%, a difference of 0.58%), Immigrants from Haiti (4.5%, a difference of 0.75%), Soviet Union (4.4%, a difference of 0.86%), and Immigrants from Jamaica (4.4%, a difference of 1.2%).
| Demographics | Rating | Rank | 4 or more Vehicles in Household |
| Immigrants | West Indies | 0.0 /100 | #314 | Tragic 4.7% |
| Immigrants | Belarus | 0.0 /100 | #315 | Tragic 4.7% |
| Puerto Ricans | 0.0 /100 | #316 | Tragic 4.7% |
| U.S. Virgin Islanders | 0.0 /100 | #317 | Tragic 4.6% |
| Jamaicans | 0.0 /100 | #318 | Tragic 4.6% |
| Haitians | 0.0 /100 | #319 | Tragic 4.6% |
| Immigrants | Haiti | 0.0 /100 | #320 | Tragic 4.5% |
| Ecuadorians | 0.0 /100 | #321 | Tragic 4.5% |
| Immigrants | Yemen | 0.0 /100 | #322 | Tragic 4.5% |
| Immigrants | Caribbean | 0.0 /100 | #323 | Tragic 4.4% |
| Soviet Union | 0.0 /100 | #324 | Tragic 4.4% |
| Immigrants | Jamaica | 0.0 /100 | #325 | Tragic 4.4% |
| Cape Verdeans | 0.0 /100 | #326 | Tragic 4.4% |
| Senegalese | 0.0 /100 | #327 | Tragic 4.3% |
| Trinidadians and Tobagonians | 0.0 /100 | #328 | Tragic 4.3% |