Bulgarian vs Ecuadorian Poverty
COMPARE
Bulgarian
Ecuadorian
Poverty
Poverty Comparison
Bulgarians
Ecuadorians
10.2%
POVERTY
99.9/ 100
METRIC RATING
10th/ 347
METRIC RANK
14.0%
POVERTY
0.4/ 100
METRIC RATING
242nd/ 347
METRIC RANK
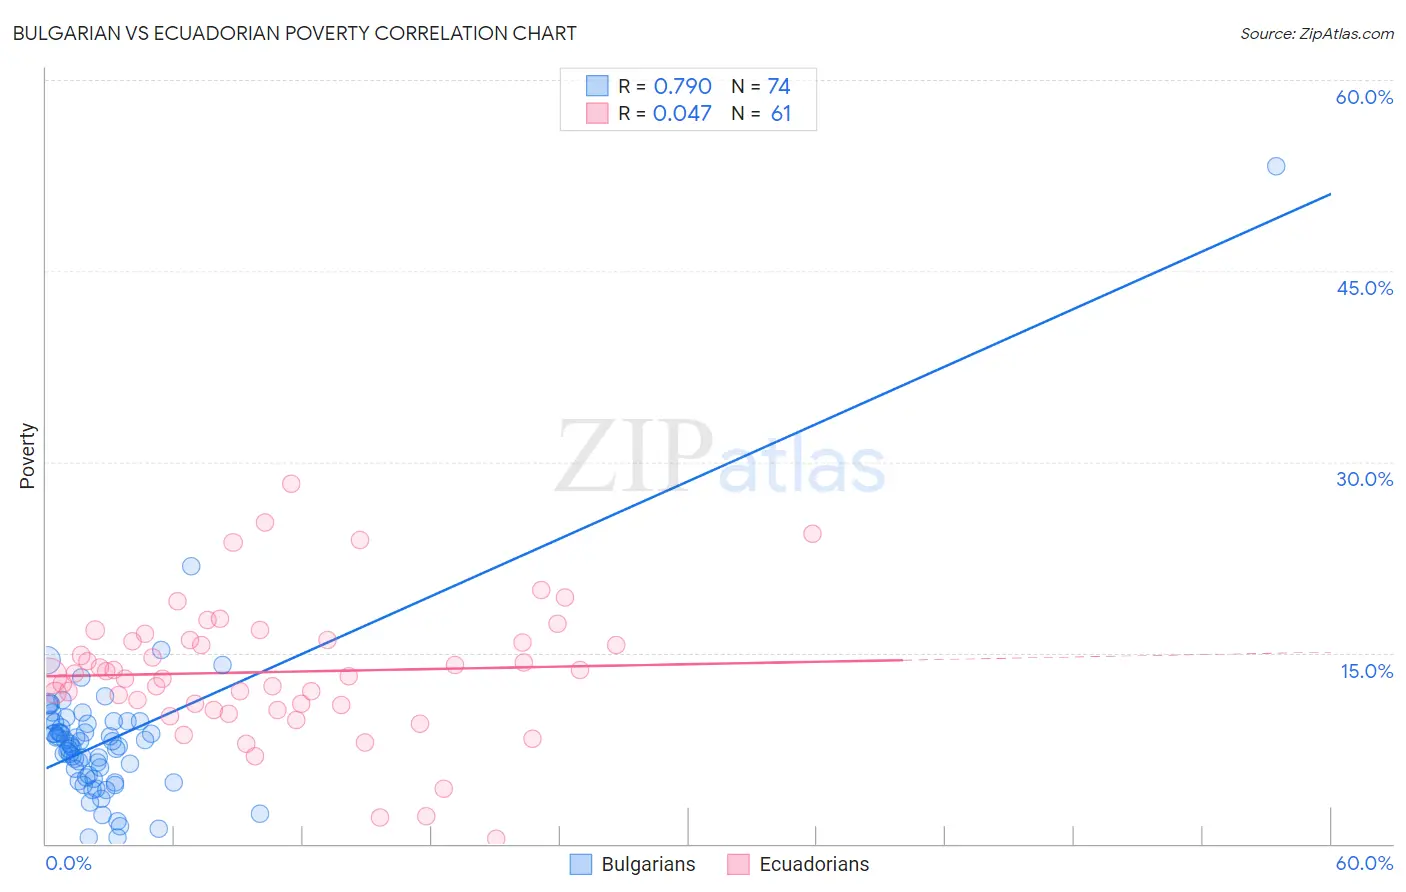
Bulgarian vs Ecuadorian Poverty Correlation Chart
The statistical analysis conducted on geographies consisting of 205,564,290 people shows a strong positive correlation between the proportion of Bulgarians and poverty level in the United States with a correlation coefficient (R) of 0.790 and weighted average of 10.2%. Similarly, the statistical analysis conducted on geographies consisting of 317,659,954 people shows no correlation between the proportion of Ecuadorians and poverty level in the United States with a correlation coefficient (R) of 0.047 and weighted average of 14.0%, a difference of 36.7%.
Poverty Correlation Summary
| Measurement | Bulgarian | Ecuadorian |
| Minimum | 0.47% | 0.41% |
| Maximum | 53.2% | 28.2% |
| Range | 52.7% | 27.8% |
| Mean | 8.2% | 13.5% |
| Median | 7.8% | 13.2% |
| Interquartile 25% (IQ1) | 5.2% | 10.7% |
| Interquartile 75% (IQ3) | 9.5% | 16.0% |
| Interquartile Range (IQR) | 4.3% | 5.3% |
| Standard Deviation (Sample) | 6.4% | 5.3% |
| Standard Deviation (Population) | 6.3% | 5.3% |
Similar Demographics by Poverty
Demographics Similar to Bulgarians by Poverty
In terms of poverty, the demographic groups most similar to Bulgarians are Immigrants from South Central Asia (10.2%, a difference of 0.41%), Maltese (10.2%, a difference of 0.86%), Immigrants from Lithuania (10.3%, a difference of 0.99%), Filipino (10.1%, a difference of 1.3%), and Bhutanese (10.4%, a difference of 1.3%).
| Demographics | Rating | Rank | Poverty |
| Thais | 100.0 /100 | #3 | Exceptional 9.6% |
| Immigrants | Taiwan | 100.0 /100 | #4 | Exceptional 9.7% |
| Immigrants | Ireland | 99.9 /100 | #5 | Exceptional 10.1% |
| Assyrians/Chaldeans/Syriacs | 99.9 /100 | #6 | Exceptional 10.1% |
| Filipinos | 99.9 /100 | #7 | Exceptional 10.1% |
| Maltese | 99.9 /100 | #8 | Exceptional 10.2% |
| Immigrants | South Central Asia | 99.9 /100 | #9 | Exceptional 10.2% |
| Bulgarians | 99.9 /100 | #10 | Exceptional 10.2% |
| Immigrants | Lithuania | 99.9 /100 | #11 | Exceptional 10.3% |
| Bhutanese | 99.8 /100 | #12 | Exceptional 10.4% |
| Immigrants | Hong Kong | 99.8 /100 | #13 | Exceptional 10.4% |
| Immigrants | Bolivia | 99.8 /100 | #14 | Exceptional 10.4% |
| Bolivians | 99.8 /100 | #15 | Exceptional 10.4% |
| Lithuanians | 99.8 /100 | #16 | Exceptional 10.5% |
| Norwegians | 99.8 /100 | #17 | Exceptional 10.5% |
Demographics Similar to Ecuadorians by Poverty
In terms of poverty, the demographic groups most similar to Ecuadorians are Sudanese (14.0%, a difference of 0.070%), Nepalese (14.0%, a difference of 0.10%), Salvadoran (14.0%, a difference of 0.31%), Immigrants from Middle Africa (14.0%, a difference of 0.34%), and Nicaraguan (13.9%, a difference of 0.46%).
| Demographics | Rating | Rank | Poverty |
| Cubans | 0.6 /100 | #235 | Tragic 13.9% |
| Immigrants | Armenia | 0.5 /100 | #236 | Tragic 13.9% |
| French American Indians | 0.5 /100 | #237 | Tragic 13.9% |
| Ghanaians | 0.5 /100 | #238 | Tragic 13.9% |
| Nicaraguans | 0.4 /100 | #239 | Tragic 13.9% |
| Immigrants | Middle Africa | 0.4 /100 | #240 | Tragic 14.0% |
| Salvadorans | 0.4 /100 | #241 | Tragic 14.0% |
| Ecuadorians | 0.4 /100 | #242 | Tragic 14.0% |
| Sudanese | 0.3 /100 | #243 | Tragic 14.0% |
| Nepalese | 0.3 /100 | #244 | Tragic 14.0% |
| Immigrants | Sudan | 0.3 /100 | #245 | Tragic 14.1% |
| Potawatomi | 0.3 /100 | #246 | Tragic 14.1% |
| Liberians | 0.2 /100 | #247 | Tragic 14.1% |
| Immigrants | Western Africa | 0.2 /100 | #248 | Tragic 14.1% |
| Immigrants | Ghana | 0.2 /100 | #249 | Tragic 14.2% |