Bulgarian vs Hmong 4 or more Vehicles in Household
COMPARE
Bulgarian
Hmong
4 or more Vehicles in Household
4 or more Vehicles in Household Comparison
Bulgarians
Hmong
5.8%
4 OR MORE VEHICLES IN HOUSEHOLD
3.1/ 100
METRIC RATING
245th/ 347
METRIC RANK
7.0%
4 OR MORE VEHICLES IN HOUSEHOLD
98.3/ 100
METRIC RATING
104th/ 347
METRIC RANK
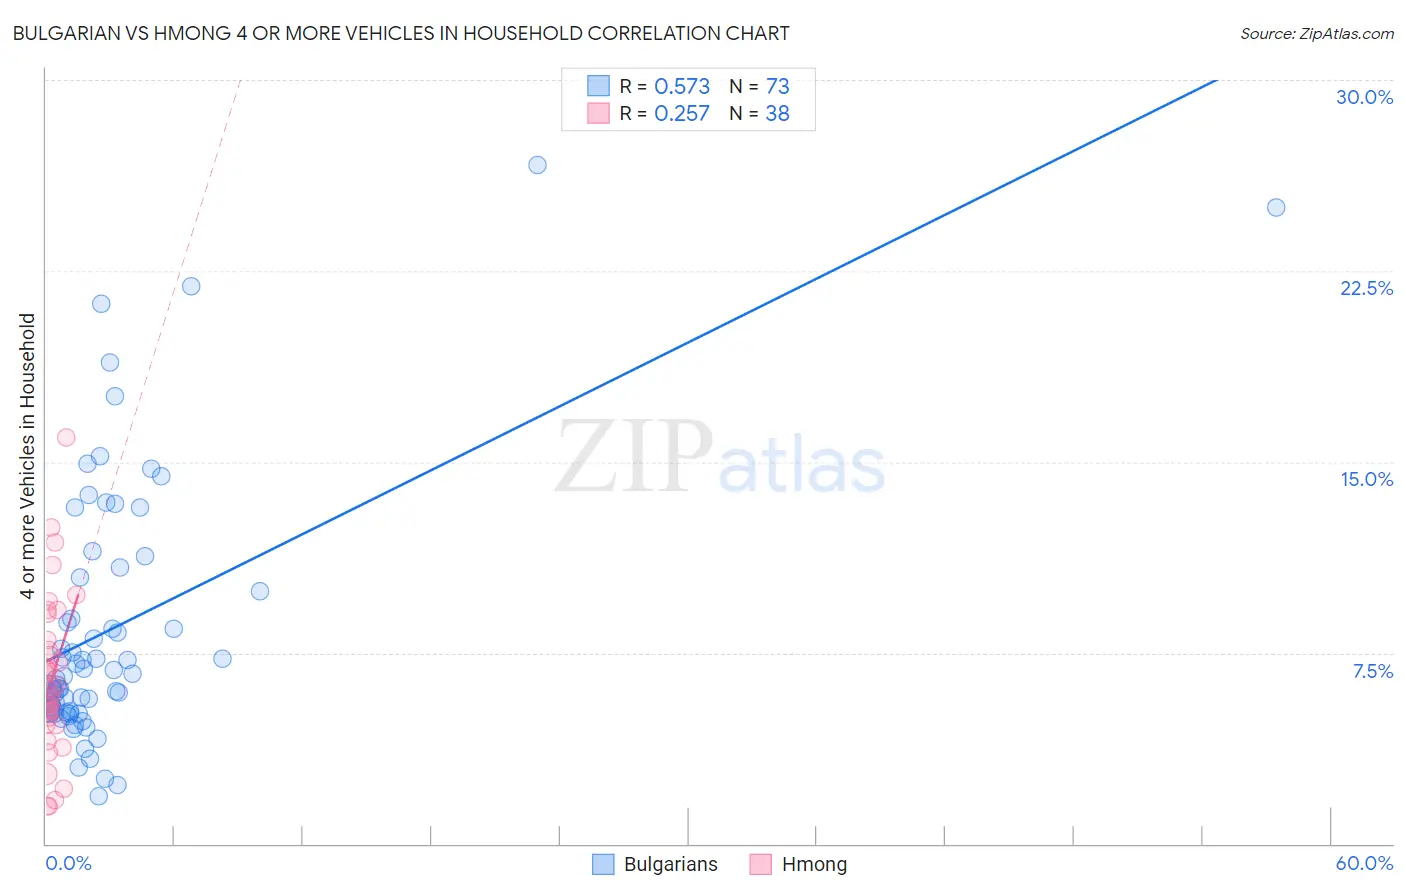
Bulgarian vs Hmong 4 or more Vehicles in Household Correlation Chart
The statistical analysis conducted on geographies consisting of 205,001,744 people shows a substantial positive correlation between the proportion of Bulgarians and percentage of households with 4 or more vehicles available in the United States with a correlation coefficient (R) of 0.573 and weighted average of 5.8%. Similarly, the statistical analysis conducted on geographies consisting of 24,663,855 people shows a weak positive correlation between the proportion of Hmong and percentage of households with 4 or more vehicles available in the United States with a correlation coefficient (R) of 0.257 and weighted average of 7.0%, a difference of 20.8%.
4 or more Vehicles in Household Correlation Summary
| Measurement | Bulgarian | Hmong |
| Minimum | 1.9% | 1.5% |
| Maximum | 26.7% | 16.0% |
| Range | 24.8% | 14.5% |
| Mean | 8.5% | 6.5% |
| Median | 6.7% | 6.1% |
| Interquartile 25% (IQ1) | 5.2% | 4.7% |
| Interquartile 75% (IQ3) | 10.6% | 8.0% |
| Interquartile Range (IQR) | 5.5% | 3.3% |
| Standard Deviation (Sample) | 5.2% | 3.1% |
| Standard Deviation (Population) | 5.2% | 3.1% |
Similar Demographics by 4 or more Vehicles in Household
Demographics Similar to Bulgarians by 4 or more Vehicles in Household
In terms of 4 or more vehicles in household, the demographic groups most similar to Bulgarians are Ethiopian (5.8%, a difference of 0.040%), Immigrants from Czechoslovakia (5.8%, a difference of 0.050%), Immigrants from Middle Africa (5.8%, a difference of 0.24%), Mongolian (5.8%, a difference of 0.45%), and Immigrants from Poland (5.8%, a difference of 0.54%).
| Demographics | Rating | Rank | 4 or more Vehicles in Household |
| Immigrants | Belgium | 4.0 /100 | #238 | Tragic 5.8% |
| Immigrants | Australia | 3.8 /100 | #239 | Tragic 5.8% |
| Immigrants | Poland | 3.8 /100 | #240 | Tragic 5.8% |
| Mongolians | 3.7 /100 | #241 | Tragic 5.8% |
| Immigrants | Middle Africa | 3.4 /100 | #242 | Tragic 5.8% |
| Immigrants | Czechoslovakia | 3.2 /100 | #243 | Tragic 5.8% |
| Ethiopians | 3.2 /100 | #244 | Tragic 5.8% |
| Bulgarians | 3.1 /100 | #245 | Tragic 5.8% |
| Immigrants | North Macedonia | 2.5 /100 | #246 | Tragic 5.7% |
| Immigrants | Ethiopia | 2.4 /100 | #247 | Tragic 5.7% |
| Immigrants | Eastern Africa | 2.4 /100 | #248 | Tragic 5.7% |
| Immigrants | Southern Europe | 2.3 /100 | #249 | Tragic 5.7% |
| Immigrants | Europe | 2.3 /100 | #250 | Tragic 5.7% |
| Ugandans | 2.2 /100 | #251 | Tragic 5.7% |
| Sub-Saharan Africans | 2.1 /100 | #252 | Tragic 5.7% |
Demographics Similar to Hmong by 4 or more Vehicles in Household
In terms of 4 or more vehicles in household, the demographic groups most similar to Hmong are German Russian (7.0%, a difference of 0.0%), Guatemalan (7.0%, a difference of 0.35%), Nicaraguan (7.0%, a difference of 0.36%), Blackfeet (7.0%, a difference of 0.48%), and Asian (7.0%, a difference of 0.49%).
| Demographics | Rating | Rank | 4 or more Vehicles in Household |
| Celtics | 99.1 /100 | #97 | Exceptional 7.1% |
| Irish | 99.0 /100 | #98 | Exceptional 7.1% |
| Seminole | 98.8 /100 | #99 | Exceptional 7.0% |
| Taiwanese | 98.7 /100 | #100 | Exceptional 7.0% |
| Pakistanis | 98.7 /100 | #101 | Exceptional 7.0% |
| Asians | 98.6 /100 | #102 | Exceptional 7.0% |
| Blackfeet | 98.6 /100 | #103 | Exceptional 7.0% |
| Hmong | 98.3 /100 | #104 | Exceptional 7.0% |
| German Russians | 98.3 /100 | #105 | Exceptional 7.0% |
| Guatemalans | 98.1 /100 | #106 | Exceptional 7.0% |
| Nicaraguans | 98.0 /100 | #107 | Exceptional 7.0% |
| French | 97.7 /100 | #108 | Exceptional 6.9% |
| Filipinos | 97.6 /100 | #109 | Exceptional 6.9% |
| Immigrants | Thailand | 97.0 /100 | #110 | Exceptional 6.9% |
| Aleuts | 97.0 /100 | #111 | Exceptional 6.9% |