British vs Immigrants from France 1 or more Vehicles in Household
COMPARE
British
Immigrants from France
1 or more Vehicles in Household
1 or more Vehicles in Household Comparison
British
Immigrants from France
92.5%
1 OR MORE VEHICLES IN HOUSEHOLD
100.0/ 100
METRIC RATING
26th/ 347
METRIC RANK
87.1%
1 OR MORE VEHICLES IN HOUSEHOLD
0.1/ 100
METRIC RATING
276th/ 347
METRIC RANK
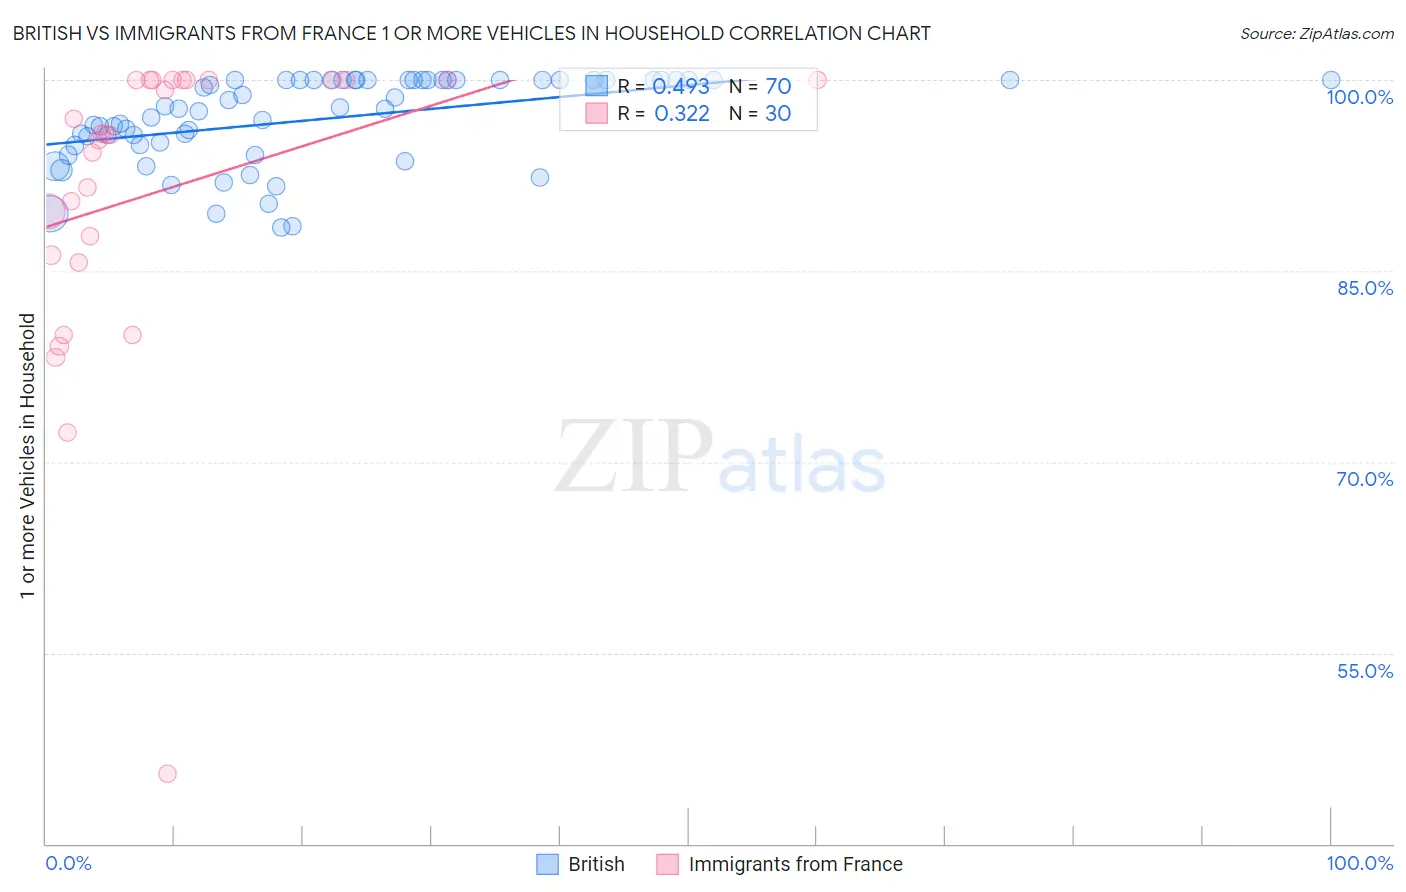
British vs Immigrants from France 1 or more Vehicles in Household Correlation Chart
The statistical analysis conducted on geographies consisting of 531,095,342 people shows a moderate positive correlation between the proportion of British and percentage of households with 1 or more vehicles available in the United States with a correlation coefficient (R) of 0.493 and weighted average of 92.5%. Similarly, the statistical analysis conducted on geographies consisting of 287,832,397 people shows a mild positive correlation between the proportion of Immigrants from France and percentage of households with 1 or more vehicles available in the United States with a correlation coefficient (R) of 0.322 and weighted average of 87.1%, a difference of 6.2%.
1 or more Vehicles in Household Correlation Summary
| Measurement | British | Immigrants from France |
| Minimum | 88.4% | 45.5% |
| Maximum | 100.0% | 100.0% |
| Range | 11.6% | 54.5% |
| Mean | 96.9% | 91.3% |
| Median | 97.8% | 95.7% |
| Interquartile 25% (IQ1) | 94.9% | 86.2% |
| Interquartile 75% (IQ3) | 100.0% | 100.0% |
| Interquartile Range (IQR) | 5.1% | 13.8% |
| Standard Deviation (Sample) | 3.4% | 11.9% |
| Standard Deviation (Population) | 3.4% | 11.7% |
Similar Demographics by 1 or more Vehicles in Household
Demographics Similar to British by 1 or more Vehicles in Household
In terms of 1 or more vehicles in household, the demographic groups most similar to British are Immigrants from Iraq (92.5%, a difference of 0.020%), Yaqui (92.6%, a difference of 0.040%), American (92.5%, a difference of 0.050%), Sri Lankan (92.5%, a difference of 0.080%), and Native Hawaiian (92.4%, a difference of 0.090%).
| Demographics | Rating | Rank | 1 or more Vehicles in Household |
| Tongans | 100.0 /100 | #19 | Exceptional 92.9% |
| Arapaho | 100.0 /100 | #20 | Exceptional 92.7% |
| Ottawa | 100.0 /100 | #21 | Exceptional 92.7% |
| French | 100.0 /100 | #22 | Exceptional 92.7% |
| Nepalese | 100.0 /100 | #23 | Exceptional 92.6% |
| Yaqui | 100.0 /100 | #24 | Exceptional 92.6% |
| Immigrants | Iraq | 100.0 /100 | #25 | Exceptional 92.5% |
| British | 100.0 /100 | #26 | Exceptional 92.5% |
| Americans | 100.0 /100 | #27 | Exceptional 92.5% |
| Sri Lankans | 100.0 /100 | #28 | Exceptional 92.5% |
| Native Hawaiians | 100.0 /100 | #29 | Exceptional 92.4% |
| Finns | 100.0 /100 | #30 | Exceptional 92.4% |
| Samoans | 100.0 /100 | #31 | Exceptional 92.4% |
| Basques | 100.0 /100 | #32 | Exceptional 92.4% |
| Cherokee | 100.0 /100 | #33 | Exceptional 92.4% |
Demographics Similar to Immigrants from France by 1 or more Vehicles in Household
In terms of 1 or more vehicles in household, the demographic groups most similar to Immigrants from France are Alsatian (87.1%, a difference of 0.060%), Immigrants from Singapore (87.2%, a difference of 0.070%), Immigrants from Southern Europe (87.1%, a difference of 0.10%), Immigrants from Albania (87.1%, a difference of 0.10%), and Immigrants from Croatia (87.0%, a difference of 0.13%).
| Demographics | Rating | Rank | 1 or more Vehicles in Household |
| Immigrants | Africa | 0.2 /100 | #269 | Tragic 87.6% |
| Panamanians | 0.2 /100 | #270 | Tragic 87.5% |
| Bermudans | 0.2 /100 | #271 | Tragic 87.5% |
| Aleuts | 0.2 /100 | #272 | Tragic 87.5% |
| Immigrants | Northern Africa | 0.2 /100 | #273 | Tragic 87.4% |
| Immigrants | Morocco | 0.1 /100 | #274 | Tragic 87.4% |
| Immigrants | Singapore | 0.1 /100 | #275 | Tragic 87.2% |
| Immigrants | France | 0.1 /100 | #276 | Tragic 87.1% |
| Alsatians | 0.1 /100 | #277 | Tragic 87.1% |
| Immigrants | Southern Europe | 0.1 /100 | #278 | Tragic 87.1% |
| Immigrants | Albania | 0.1 /100 | #279 | Tragic 87.1% |
| Immigrants | Croatia | 0.0 /100 | #280 | Tragic 87.0% |
| Mongolians | 0.0 /100 | #281 | Tragic 87.0% |
| Colville | 0.0 /100 | #282 | Tragic 86.8% |
| Immigrants | Eastern Europe | 0.0 /100 | #283 | Tragic 86.7% |