Guamanian/Chamorro vs Immigrants from France 1 or more Vehicles in Household
COMPARE
Guamanian/Chamorro
Immigrants from France
1 or more Vehicles in Household
1 or more Vehicles in Household Comparison
Guamanians/Chamorros
Immigrants from France
92.1%
1 OR MORE VEHICLES IN HOUSEHOLD
99.9/ 100
METRIC RATING
50th/ 347
METRIC RANK
87.1%
1 OR MORE VEHICLES IN HOUSEHOLD
0.1/ 100
METRIC RATING
276th/ 347
METRIC RANK
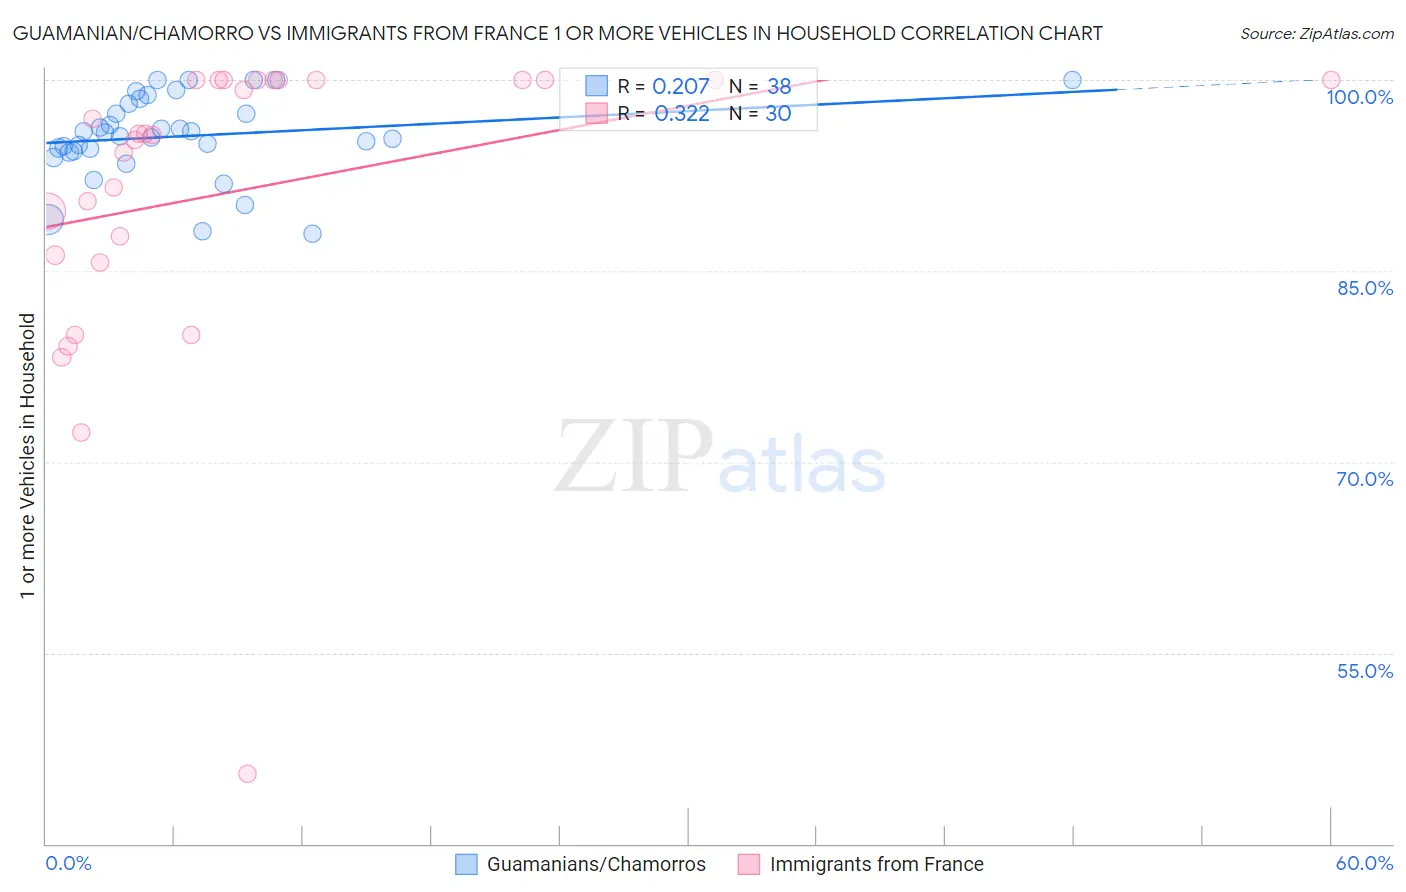
Guamanian/Chamorro vs Immigrants from France 1 or more Vehicles in Household Correlation Chart
The statistical analysis conducted on geographies consisting of 221,882,598 people shows a weak positive correlation between the proportion of Guamanians/Chamorros and percentage of households with 1 or more vehicles available in the United States with a correlation coefficient (R) of 0.207 and weighted average of 92.1%. Similarly, the statistical analysis conducted on geographies consisting of 287,832,397 people shows a mild positive correlation between the proportion of Immigrants from France and percentage of households with 1 or more vehicles available in the United States with a correlation coefficient (R) of 0.322 and weighted average of 87.1%, a difference of 5.7%.
1 or more Vehicles in Household Correlation Summary
| Measurement | Guamanian/Chamorro | Immigrants from France |
| Minimum | 87.9% | 45.5% |
| Maximum | 100.0% | 100.0% |
| Range | 12.1% | 54.5% |
| Mean | 95.6% | 91.3% |
| Median | 95.7% | 95.7% |
| Interquartile 25% (IQ1) | 94.4% | 86.2% |
| Interquartile 75% (IQ3) | 98.1% | 100.0% |
| Interquartile Range (IQR) | 3.7% | 13.8% |
| Standard Deviation (Sample) | 3.2% | 11.9% |
| Standard Deviation (Population) | 3.2% | 11.7% |
Similar Demographics by 1 or more Vehicles in Household
Demographics Similar to Guamanians/Chamorros by 1 or more Vehicles in Household
In terms of 1 or more vehicles in household, the demographic groups most similar to Guamanians/Chamorros are Afghan (92.1%, a difference of 0.010%), Celtic (92.1%, a difference of 0.010%), Belgian (92.1%, a difference of 0.020%), Korean (92.1%, a difference of 0.040%), and Hawaiian (92.0%, a difference of 0.070%).
| Demographics | Rating | Rank | 1 or more Vehicles in Household |
| Spanish | 99.9 /100 | #43 | Exceptional 92.3% |
| Choctaw | 99.9 /100 | #44 | Exceptional 92.2% |
| Immigrants | Nonimmigrants | 99.9 /100 | #45 | Exceptional 92.2% |
| Immigrants | Fiji | 99.9 /100 | #46 | Exceptional 92.2% |
| Northern Europeans | 99.9 /100 | #47 | Exceptional 92.2% |
| Belgians | 99.9 /100 | #48 | Exceptional 92.1% |
| Afghans | 99.9 /100 | #49 | Exceptional 92.1% |
| Guamanians/Chamorros | 99.9 /100 | #50 | Exceptional 92.1% |
| Celtics | 99.9 /100 | #51 | Exceptional 92.1% |
| Koreans | 99.9 /100 | #52 | Exceptional 92.1% |
| Hawaiians | 99.9 /100 | #53 | Exceptional 92.0% |
| Slovenes | 99.9 /100 | #54 | Exceptional 92.0% |
| Immigrants | Afghanistan | 99.9 /100 | #55 | Exceptional 92.0% |
| Immigrants | Venezuela | 99.9 /100 | #56 | Exceptional 92.0% |
| Iraqis | 99.8 /100 | #57 | Exceptional 91.9% |
Demographics Similar to Immigrants from France by 1 or more Vehicles in Household
In terms of 1 or more vehicles in household, the demographic groups most similar to Immigrants from France are Alsatian (87.1%, a difference of 0.060%), Immigrants from Singapore (87.2%, a difference of 0.070%), Immigrants from Southern Europe (87.1%, a difference of 0.10%), Immigrants from Albania (87.1%, a difference of 0.10%), and Immigrants from Croatia (87.0%, a difference of 0.13%).
| Demographics | Rating | Rank | 1 or more Vehicles in Household |
| Immigrants | Africa | 0.2 /100 | #269 | Tragic 87.6% |
| Panamanians | 0.2 /100 | #270 | Tragic 87.5% |
| Bermudans | 0.2 /100 | #271 | Tragic 87.5% |
| Aleuts | 0.2 /100 | #272 | Tragic 87.5% |
| Immigrants | Northern Africa | 0.2 /100 | #273 | Tragic 87.4% |
| Immigrants | Morocco | 0.1 /100 | #274 | Tragic 87.4% |
| Immigrants | Singapore | 0.1 /100 | #275 | Tragic 87.2% |
| Immigrants | France | 0.1 /100 | #276 | Tragic 87.1% |
| Alsatians | 0.1 /100 | #277 | Tragic 87.1% |
| Immigrants | Southern Europe | 0.1 /100 | #278 | Tragic 87.1% |
| Immigrants | Albania | 0.1 /100 | #279 | Tragic 87.1% |
| Immigrants | Croatia | 0.0 /100 | #280 | Tragic 87.0% |
| Mongolians | 0.0 /100 | #281 | Tragic 87.0% |
| Colville | 0.0 /100 | #282 | Tragic 86.8% |
| Immigrants | Eastern Europe | 0.0 /100 | #283 | Tragic 86.7% |