British vs Norwegian 1 or more Vehicles in Household
COMPARE
British
Norwegian
1 or more Vehicles in Household
1 or more Vehicles in Household Comparison
British
Norwegians
92.5%
1 OR MORE VEHICLES IN HOUSEHOLD
100.0/ 100
METRIC RATING
26th/ 347
METRIC RANK
93.7%
1 OR MORE VEHICLES IN HOUSEHOLD
100.0/ 100
METRIC RATING
3rd/ 347
METRIC RANK
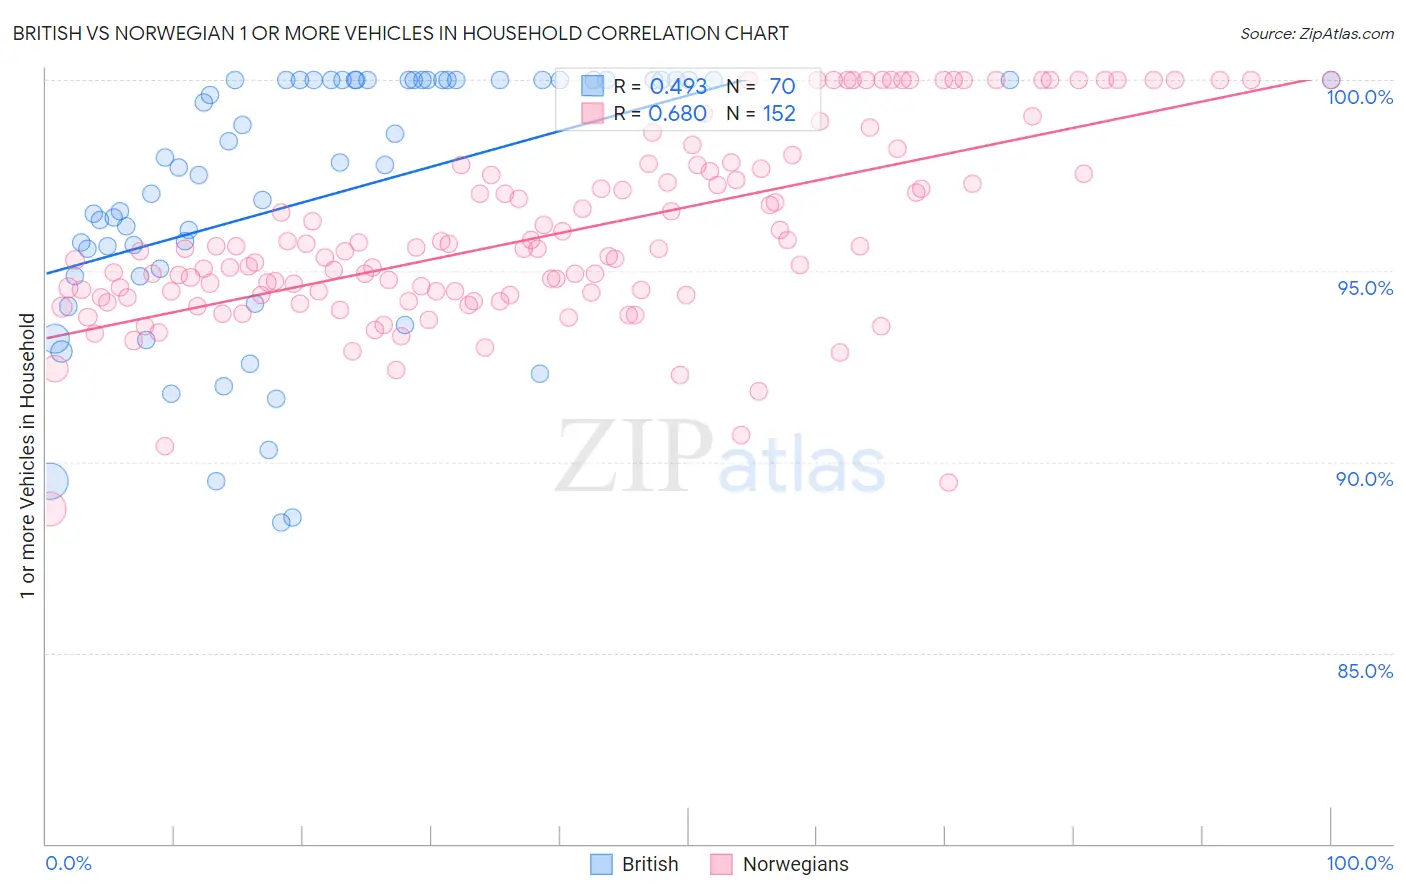
British vs Norwegian 1 or more Vehicles in Household Correlation Chart
The statistical analysis conducted on geographies consisting of 531,095,342 people shows a moderate positive correlation between the proportion of British and percentage of households with 1 or more vehicles available in the United States with a correlation coefficient (R) of 0.493 and weighted average of 92.5%. Similarly, the statistical analysis conducted on geographies consisting of 532,998,902 people shows a significant positive correlation between the proportion of Norwegians and percentage of households with 1 or more vehicles available in the United States with a correlation coefficient (R) of 0.680 and weighted average of 93.7%, a difference of 1.3%.
1 or more Vehicles in Household Correlation Summary
| Measurement | British | Norwegian |
| Minimum | 88.4% | 88.8% |
| Maximum | 100.0% | 100.0% |
| Range | 11.6% | 11.2% |
| Mean | 96.9% | 95.9% |
| Median | 97.8% | 95.5% |
| Interquartile 25% (IQ1) | 94.9% | 94.4% |
| Interquartile 75% (IQ3) | 100.0% | 97.6% |
| Interquartile Range (IQR) | 5.1% | 3.2% |
| Standard Deviation (Sample) | 3.4% | 2.4% |
| Standard Deviation (Population) | 3.4% | 2.4% |
Similar Demographics by 1 or more Vehicles in Household
Demographics Similar to British by 1 or more Vehicles in Household
In terms of 1 or more vehicles in household, the demographic groups most similar to British are Immigrants from Iraq (92.5%, a difference of 0.020%), Yaqui (92.6%, a difference of 0.040%), American (92.5%, a difference of 0.050%), Sri Lankan (92.5%, a difference of 0.080%), and Native Hawaiian (92.4%, a difference of 0.090%).
| Demographics | Rating | Rank | 1 or more Vehicles in Household |
| Tongans | 100.0 /100 | #19 | Exceptional 92.9% |
| Arapaho | 100.0 /100 | #20 | Exceptional 92.7% |
| Ottawa | 100.0 /100 | #21 | Exceptional 92.7% |
| French | 100.0 /100 | #22 | Exceptional 92.7% |
| Nepalese | 100.0 /100 | #23 | Exceptional 92.6% |
| Yaqui | 100.0 /100 | #24 | Exceptional 92.6% |
| Immigrants | Iraq | 100.0 /100 | #25 | Exceptional 92.5% |
| British | 100.0 /100 | #26 | Exceptional 92.5% |
| Americans | 100.0 /100 | #27 | Exceptional 92.5% |
| Sri Lankans | 100.0 /100 | #28 | Exceptional 92.5% |
| Native Hawaiians | 100.0 /100 | #29 | Exceptional 92.4% |
| Finns | 100.0 /100 | #30 | Exceptional 92.4% |
| Samoans | 100.0 /100 | #31 | Exceptional 92.4% |
| Basques | 100.0 /100 | #32 | Exceptional 92.4% |
| Cherokee | 100.0 /100 | #33 | Exceptional 92.4% |
Demographics Similar to Norwegians by 1 or more Vehicles in Household
In terms of 1 or more vehicles in household, the demographic groups most similar to Norwegians are German (93.6%, a difference of 0.050%), English (93.8%, a difference of 0.13%), Yakama (93.6%, a difference of 0.14%), Danish (93.5%, a difference of 0.16%), and Scottish (93.4%, a difference of 0.35%).
| Demographics | Rating | Rank | 1 or more Vehicles in Household |
| Luxembourgers | 100.0 /100 | #1 | Exceptional 94.8% |
| English | 100.0 /100 | #2 | Exceptional 93.8% |
| Norwegians | 100.0 /100 | #3 | Exceptional 93.7% |
| Germans | 100.0 /100 | #4 | Exceptional 93.6% |
| Yakama | 100.0 /100 | #5 | Exceptional 93.6% |
| Danes | 100.0 /100 | #6 | Exceptional 93.5% |
| Scottish | 100.0 /100 | #7 | Exceptional 93.4% |
| Swedes | 100.0 /100 | #8 | Exceptional 93.3% |
| Scotch-Irish | 100.0 /100 | #9 | Exceptional 93.3% |
| Dutch | 100.0 /100 | #10 | Exceptional 93.3% |
| Czechs | 100.0 /100 | #11 | Exceptional 93.3% |
| Scandinavians | 100.0 /100 | #12 | Exceptional 93.1% |
| Whites/Caucasians | 100.0 /100 | #13 | Exceptional 93.1% |
| Irish | 100.0 /100 | #14 | Exceptional 93.1% |
| Mexicans | 100.0 /100 | #15 | Exceptional 93.0% |