British vs Immigrants from Eastern Africa 1 or more Vehicles in Household
COMPARE
British
Immigrants from Eastern Africa
1 or more Vehicles in Household
1 or more Vehicles in Household Comparison
British
Immigrants from Eastern Africa
92.5%
1 OR MORE VEHICLES IN HOUSEHOLD
100.0/ 100
METRIC RATING
26th/ 347
METRIC RANK
90.1%
1 OR MORE VEHICLES IN HOUSEHOLD
78.2/ 100
METRIC RATING
148th/ 347
METRIC RANK
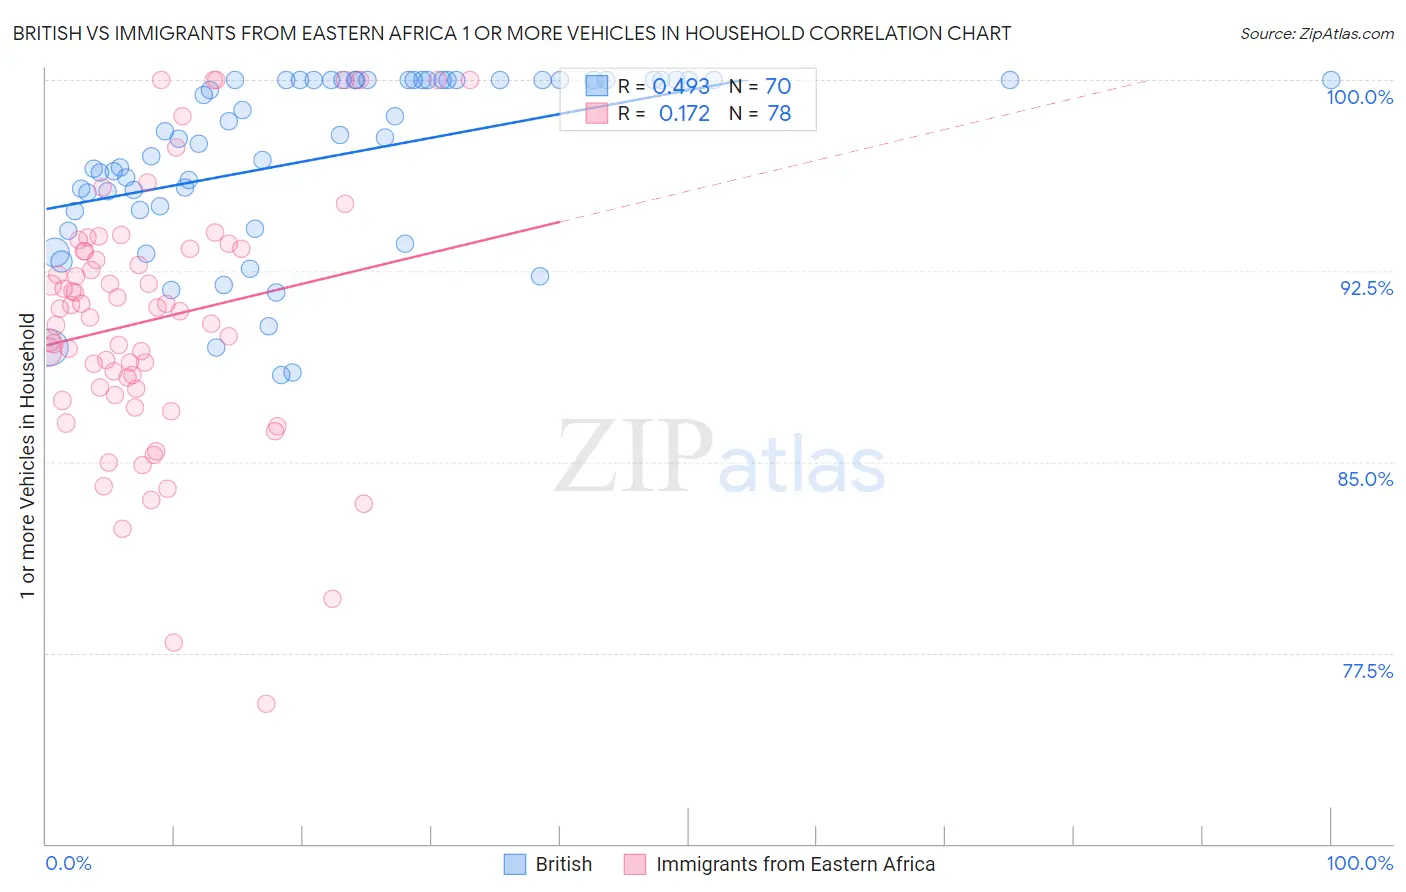
British vs Immigrants from Eastern Africa 1 or more Vehicles in Household Correlation Chart
The statistical analysis conducted on geographies consisting of 531,095,342 people shows a moderate positive correlation between the proportion of British and percentage of households with 1 or more vehicles available in the United States with a correlation coefficient (R) of 0.493 and weighted average of 92.5%. Similarly, the statistical analysis conducted on geographies consisting of 354,905,659 people shows a poor positive correlation between the proportion of Immigrants from Eastern Africa and percentage of households with 1 or more vehicles available in the United States with a correlation coefficient (R) of 0.172 and weighted average of 90.1%, a difference of 2.6%.
1 or more Vehicles in Household Correlation Summary
| Measurement | British | Immigrants from Eastern Africa |
| Minimum | 88.4% | 75.5% |
| Maximum | 100.0% | 100.0% |
| Range | 11.6% | 24.5% |
| Mean | 96.9% | 90.6% |
| Median | 97.8% | 91.0% |
| Interquartile 25% (IQ1) | 94.9% | 87.9% |
| Interquartile 75% (IQ3) | 100.0% | 93.4% |
| Interquartile Range (IQR) | 5.1% | 5.5% |
| Standard Deviation (Sample) | 3.4% | 5.0% |
| Standard Deviation (Population) | 3.4% | 5.0% |
Similar Demographics by 1 or more Vehicles in Household
Demographics Similar to British by 1 or more Vehicles in Household
In terms of 1 or more vehicles in household, the demographic groups most similar to British are Immigrants from Iraq (92.5%, a difference of 0.020%), Yaqui (92.6%, a difference of 0.040%), American (92.5%, a difference of 0.050%), Sri Lankan (92.5%, a difference of 0.080%), and Native Hawaiian (92.4%, a difference of 0.090%).
| Demographics | Rating | Rank | 1 or more Vehicles in Household |
| Tongans | 100.0 /100 | #19 | Exceptional 92.9% |
| Arapaho | 100.0 /100 | #20 | Exceptional 92.7% |
| Ottawa | 100.0 /100 | #21 | Exceptional 92.7% |
| French | 100.0 /100 | #22 | Exceptional 92.7% |
| Nepalese | 100.0 /100 | #23 | Exceptional 92.6% |
| Yaqui | 100.0 /100 | #24 | Exceptional 92.6% |
| Immigrants | Iraq | 100.0 /100 | #25 | Exceptional 92.5% |
| British | 100.0 /100 | #26 | Exceptional 92.5% |
| Americans | 100.0 /100 | #27 | Exceptional 92.5% |
| Sri Lankans | 100.0 /100 | #28 | Exceptional 92.5% |
| Native Hawaiians | 100.0 /100 | #29 | Exceptional 92.4% |
| Finns | 100.0 /100 | #30 | Exceptional 92.4% |
| Samoans | 100.0 /100 | #31 | Exceptional 92.4% |
| Basques | 100.0 /100 | #32 | Exceptional 92.4% |
| Cherokee | 100.0 /100 | #33 | Exceptional 92.4% |
Demographics Similar to Immigrants from Eastern Africa by 1 or more Vehicles in Household
In terms of 1 or more vehicles in household, the demographic groups most similar to Immigrants from Eastern Africa are Immigrants from Nicaragua (90.1%, a difference of 0.030%), Chilean (90.2%, a difference of 0.040%), Bahamian (90.2%, a difference of 0.050%), Immigrants from Micronesia (90.1%, a difference of 0.050%), and Immigrants from Bosnia and Herzegovina (90.1%, a difference of 0.060%).
| Demographics | Rating | Rank | 1 or more Vehicles in Household |
| Immigrants | Moldova | 83.1 /100 | #141 | Excellent 90.2% |
| Immigrants | Lithuania | 83.0 /100 | #142 | Excellent 90.2% |
| Immigrants | Bahamas | 81.5 /100 | #143 | Excellent 90.2% |
| Immigrants | Zimbabwe | 81.5 /100 | #144 | Excellent 90.2% |
| Sioux | 81.3 /100 | #145 | Excellent 90.2% |
| Bahamians | 80.5 /100 | #146 | Excellent 90.2% |
| Chileans | 79.8 /100 | #147 | Good 90.2% |
| Immigrants | Eastern Africa | 78.2 /100 | #148 | Good 90.1% |
| Immigrants | Nicaragua | 76.7 /100 | #149 | Good 90.1% |
| Immigrants | Micronesia | 75.9 /100 | #150 | Good 90.1% |
| Immigrants | Bosnia and Herzegovina | 75.4 /100 | #151 | Good 90.1% |
| Tlingit-Haida | 74.3 /100 | #152 | Good 90.1% |
| New Zealanders | 73.8 /100 | #153 | Good 90.1% |
| Immigrants | Uganda | 73.8 /100 | #154 | Good 90.1% |
| Immigrants | Immigrants | 73.6 /100 | #155 | Good 90.1% |