Tsimshian vs Immigrants from France 1 or more Vehicles in Household
COMPARE
Tsimshian
Immigrants from France
1 or more Vehicles in Household
1 or more Vehicles in Household Comparison
Tsimshian
Immigrants from France
91.4%
1 OR MORE VEHICLES IN HOUSEHOLD
99.3/ 100
METRIC RATING
85th/ 347
METRIC RANK
87.1%
1 OR MORE VEHICLES IN HOUSEHOLD
0.1/ 100
METRIC RATING
276th/ 347
METRIC RANK
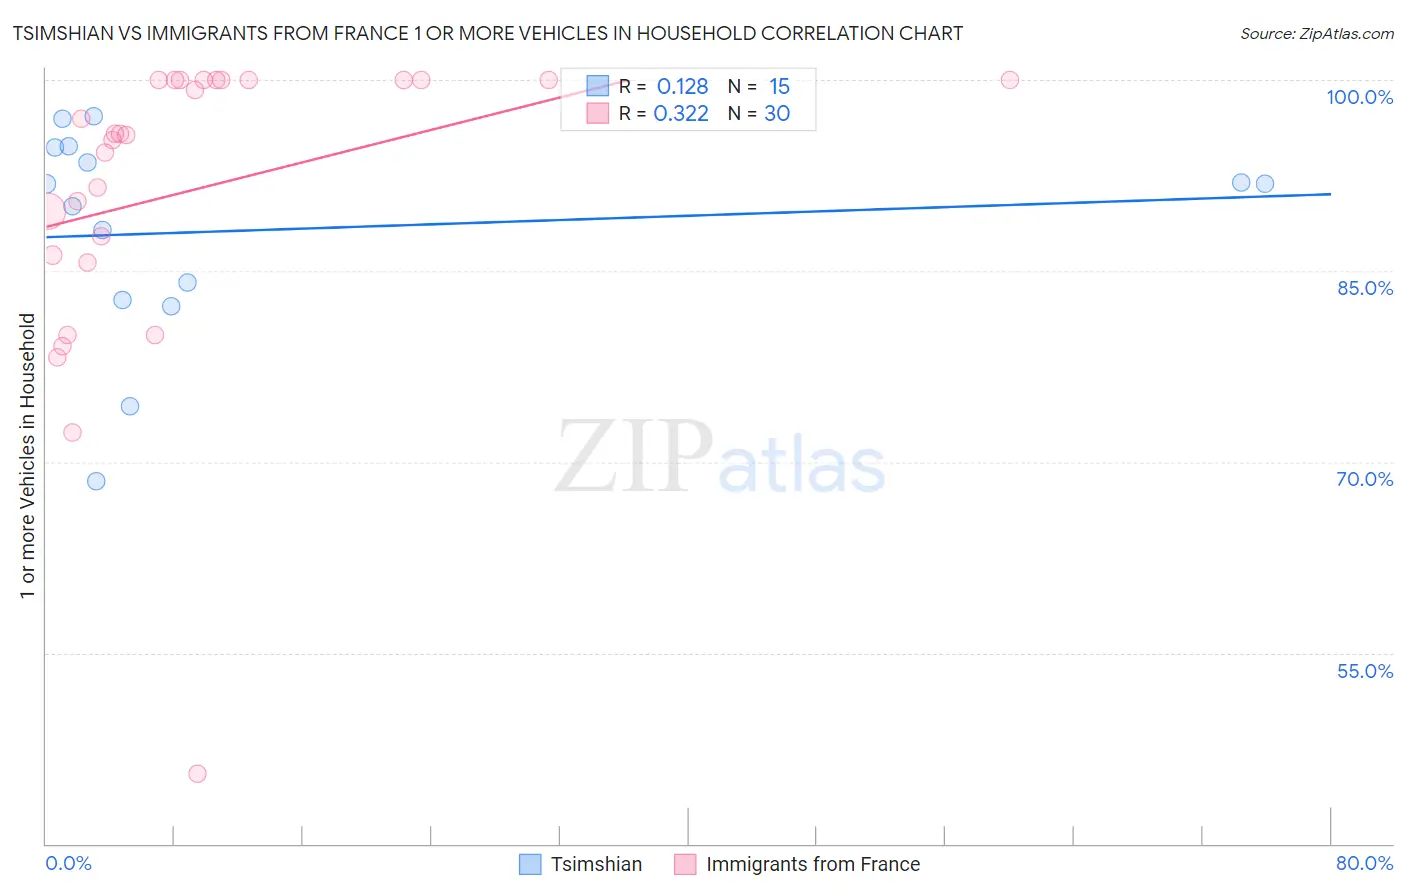
Tsimshian vs Immigrants from France 1 or more Vehicles in Household Correlation Chart
The statistical analysis conducted on geographies consisting of 15,626,544 people shows a poor positive correlation between the proportion of Tsimshian and percentage of households with 1 or more vehicles available in the United States with a correlation coefficient (R) of 0.128 and weighted average of 91.4%. Similarly, the statistical analysis conducted on geographies consisting of 287,832,397 people shows a mild positive correlation between the proportion of Immigrants from France and percentage of households with 1 or more vehicles available in the United States with a correlation coefficient (R) of 0.322 and weighted average of 87.1%, a difference of 4.9%.
1 or more Vehicles in Household Correlation Summary
| Measurement | Tsimshian | Immigrants from France |
| Minimum | 68.5% | 45.5% |
| Maximum | 97.2% | 100.0% |
| Range | 28.6% | 54.5% |
| Mean | 88.2% | 91.3% |
| Median | 91.8% | 95.7% |
| Interquartile 25% (IQ1) | 82.7% | 86.2% |
| Interquartile 75% (IQ3) | 94.7% | 100.0% |
| Interquartile Range (IQR) | 12.0% | 13.8% |
| Standard Deviation (Sample) | 8.4% | 11.9% |
| Standard Deviation (Population) | 8.1% | 11.7% |
Similar Demographics by 1 or more Vehicles in Household
Demographics Similar to Tsimshian by 1 or more Vehicles in Household
In terms of 1 or more vehicles in household, the demographic groups most similar to Tsimshian are Jordanian (91.4%, a difference of 0.010%), Lebanese (91.4%, a difference of 0.020%), Immigrants from England (91.4%, a difference of 0.020%), Osage (91.4%, a difference of 0.020%), and Immigrants from South Eastern Asia (91.4%, a difference of 0.030%).
| Demographics | Rating | Rank | 1 or more Vehicles in Household |
| Iranians | 99.4 /100 | #78 | Exceptional 91.5% |
| Immigrants | South Central Asia | 99.4 /100 | #79 | Exceptional 91.5% |
| Bolivians | 99.4 /100 | #80 | Exceptional 91.5% |
| Immigrants | South Eastern Asia | 99.3 /100 | #81 | Exceptional 91.4% |
| Lebanese | 99.3 /100 | #82 | Exceptional 91.4% |
| Immigrants | England | 99.3 /100 | #83 | Exceptional 91.4% |
| Jordanians | 99.3 /100 | #84 | Exceptional 91.4% |
| Tsimshian | 99.3 /100 | #85 | Exceptional 91.4% |
| Osage | 99.2 /100 | #86 | Exceptional 91.4% |
| Immigrants | Germany | 99.2 /100 | #87 | Exceptional 91.4% |
| Spanish Americans | 99.2 /100 | #88 | Exceptional 91.4% |
| Bangladeshis | 99.2 /100 | #89 | Exceptional 91.4% |
| Immigrants | Canada | 99.2 /100 | #90 | Exceptional 91.4% |
| Immigrants | Jordan | 99.2 /100 | #91 | Exceptional 91.4% |
| Bhutanese | 99.2 /100 | #92 | Exceptional 91.4% |
Demographics Similar to Immigrants from France by 1 or more Vehicles in Household
In terms of 1 or more vehicles in household, the demographic groups most similar to Immigrants from France are Alsatian (87.1%, a difference of 0.060%), Immigrants from Singapore (87.2%, a difference of 0.070%), Immigrants from Southern Europe (87.1%, a difference of 0.10%), Immigrants from Albania (87.1%, a difference of 0.10%), and Immigrants from Croatia (87.0%, a difference of 0.13%).
| Demographics | Rating | Rank | 1 or more Vehicles in Household |
| Immigrants | Africa | 0.2 /100 | #269 | Tragic 87.6% |
| Panamanians | 0.2 /100 | #270 | Tragic 87.5% |
| Bermudans | 0.2 /100 | #271 | Tragic 87.5% |
| Aleuts | 0.2 /100 | #272 | Tragic 87.5% |
| Immigrants | Northern Africa | 0.2 /100 | #273 | Tragic 87.4% |
| Immigrants | Morocco | 0.1 /100 | #274 | Tragic 87.4% |
| Immigrants | Singapore | 0.1 /100 | #275 | Tragic 87.2% |
| Immigrants | France | 0.1 /100 | #276 | Tragic 87.1% |
| Alsatians | 0.1 /100 | #277 | Tragic 87.1% |
| Immigrants | Southern Europe | 0.1 /100 | #278 | Tragic 87.1% |
| Immigrants | Albania | 0.1 /100 | #279 | Tragic 87.1% |
| Immigrants | Croatia | 0.0 /100 | #280 | Tragic 87.0% |
| Mongolians | 0.0 /100 | #281 | Tragic 87.0% |
| Colville | 0.0 /100 | #282 | Tragic 86.8% |
| Immigrants | Eastern Europe | 0.0 /100 | #283 | Tragic 86.7% |