British vs Immigrants from France Family Households
COMPARE
British
Immigrants from France
Family Households
Family Households Comparison
British
Immigrants from France
64.4%
FAMILY HOUSEHOLDS
61.6/ 100
METRIC RATING
162nd/ 347
METRIC RANK
61.3%
FAMILY HOUSEHOLDS
0.0/ 100
METRIC RATING
331st/ 347
METRIC RANK
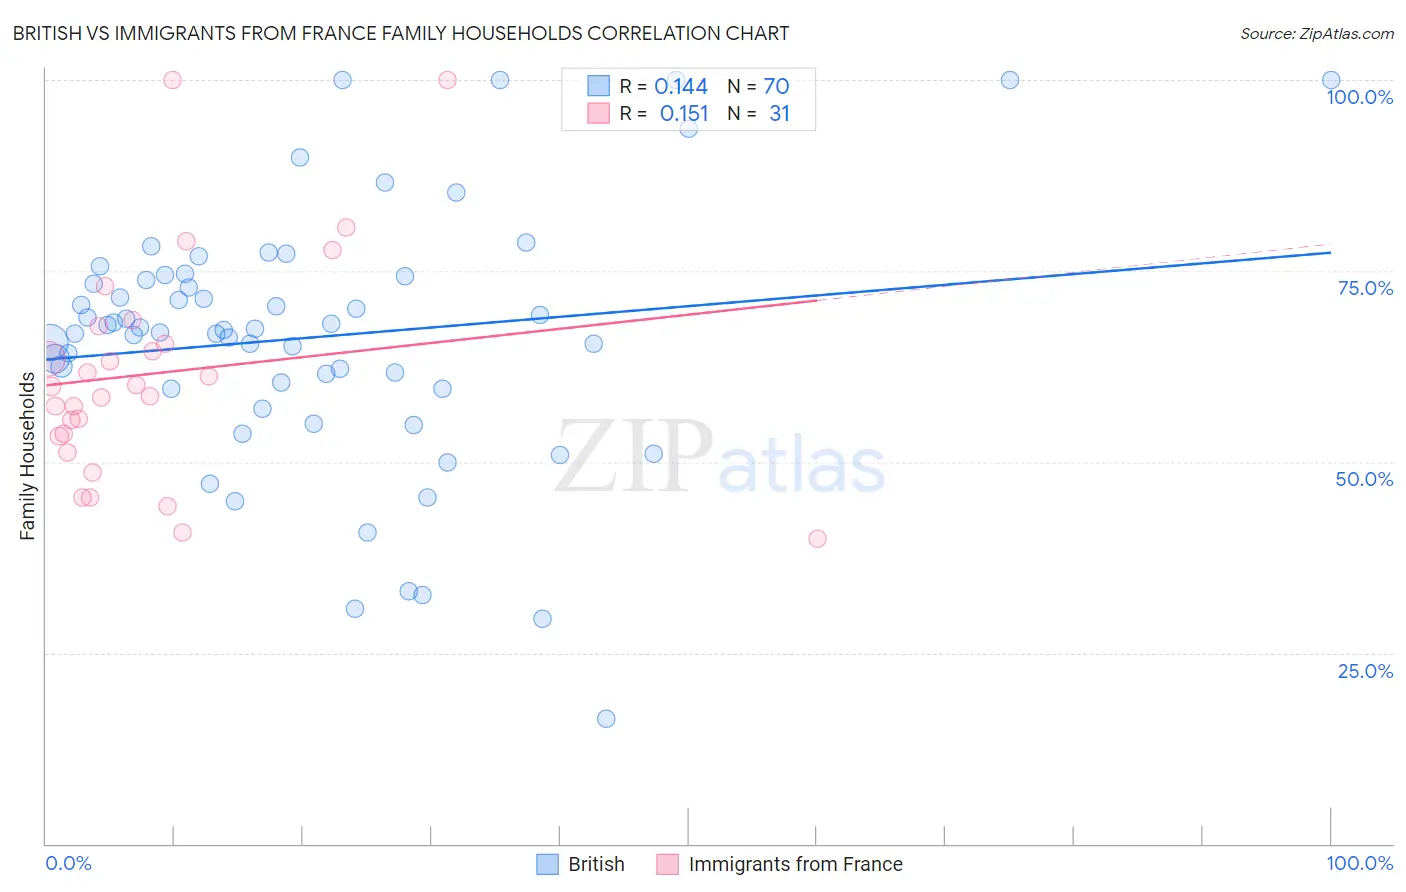
British vs Immigrants from France Family Households Correlation Chart
The statistical analysis conducted on geographies consisting of 531,009,478 people shows a poor positive correlation between the proportion of British and percentage of family households in the United States with a correlation coefficient (R) of 0.144 and weighted average of 64.4%. Similarly, the statistical analysis conducted on geographies consisting of 287,855,925 people shows a poor positive correlation between the proportion of Immigrants from France and percentage of family households in the United States with a correlation coefficient (R) of 0.151 and weighted average of 61.3%, a difference of 5.1%.
Family Households Correlation Summary
| Measurement | British | Immigrants from France |
| Minimum | 16.4% | 40.0% |
| Maximum | 100.0% | 100.0% |
| Range | 83.6% | 60.0% |
| Mean | 66.4% | 61.7% |
| Median | 67.4% | 59.9% |
| Interquartile 25% (IQ1) | 59.6% | 53.3% |
| Interquartile 75% (IQ3) | 74.3% | 67.7% |
| Interquartile Range (IQR) | 14.8% | 14.4% |
| Standard Deviation (Sample) | 16.9% | 14.6% |
| Standard Deviation (Population) | 16.8% | 14.4% |
Similar Demographics by Family Households
Demographics Similar to British by Family Households
In terms of family households, the demographic groups most similar to British are Chickasaw (64.4%, a difference of 0.0%), Immigrants from England (64.4%, a difference of 0.010%), Immigrants from Nigeria (64.4%, a difference of 0.020%), Immigrants from Southern Europe (64.4%, a difference of 0.020%), and Scotch-Irish (64.4%, a difference of 0.030%).
| Demographics | Rating | Rank | Family Households |
| Uruguayans | 67.7 /100 | #155 | Good 64.5% |
| Czechs | 67.0 /100 | #156 | Good 64.5% |
| Canadians | 66.6 /100 | #157 | Good 64.4% |
| Lebanese | 66.4 /100 | #158 | Good 64.4% |
| Germans | 65.8 /100 | #159 | Good 64.4% |
| Immigrants | Moldova | 65.2 /100 | #160 | Good 64.4% |
| Immigrants | England | 62.6 /100 | #161 | Good 64.4% |
| British | 61.6 /100 | #162 | Good 64.4% |
| Chickasaw | 61.5 /100 | #163 | Good 64.4% |
| Immigrants | Nigeria | 60.1 /100 | #164 | Good 64.4% |
| Immigrants | Southern Europe | 60.0 /100 | #165 | Good 64.4% |
| Scotch-Irish | 59.2 /100 | #166 | Average 64.4% |
| Irish | 57.9 /100 | #167 | Average 64.4% |
| Hondurans | 57.5 /100 | #168 | Average 64.4% |
| Iraqis | 56.0 /100 | #169 | Average 64.4% |
Demographics Similar to Immigrants from France by Family Households
In terms of family households, the demographic groups most similar to Immigrants from France are Immigrants from Australia (61.3%, a difference of 0.0%), Ethiopian (61.2%, a difference of 0.070%), Cambodian (61.4%, a difference of 0.14%), Kiowa (61.4%, a difference of 0.16%), and Immigrants from Ethiopia (61.2%, a difference of 0.16%).
| Demographics | Rating | Rank | Family Households |
| Immigrants | West Indies | 0.0 /100 | #324 | Tragic 61.6% |
| Immigrants | Switzerland | 0.0 /100 | #325 | Tragic 61.6% |
| Indonesians | 0.0 /100 | #326 | Tragic 61.5% |
| Blacks/African Americans | 0.0 /100 | #327 | Tragic 61.5% |
| Kiowa | 0.0 /100 | #328 | Tragic 61.4% |
| Cambodians | 0.0 /100 | #329 | Tragic 61.4% |
| Immigrants | Australia | 0.0 /100 | #330 | Tragic 61.3% |
| Immigrants | France | 0.0 /100 | #331 | Tragic 61.3% |
| Ethiopians | 0.0 /100 | #332 | Tragic 61.2% |
| Immigrants | Ethiopia | 0.0 /100 | #333 | Tragic 61.2% |
| Immigrants | Eastern Africa | 0.0 /100 | #334 | Tragic 61.1% |
| Carpatho Rusyns | 0.0 /100 | #335 | Tragic 61.1% |
| German Russians | 0.0 /100 | #336 | Tragic 60.9% |
| Soviet Union | 0.0 /100 | #337 | Tragic 60.9% |
| Immigrants | Eritrea | 0.0 /100 | #338 | Tragic 60.8% |