Cheyenne vs Immigrants from France 1 or more Vehicles in Household
COMPARE
Cheyenne
Immigrants from France
1 or more Vehicles in Household
1 or more Vehicles in Household Comparison
Cheyenne
Immigrants from France
88.7%
1 OR MORE VEHICLES IN HOUSEHOLD
5.7/ 100
METRIC RATING
226th/ 347
METRIC RANK
87.1%
1 OR MORE VEHICLES IN HOUSEHOLD
0.1/ 100
METRIC RATING
276th/ 347
METRIC RANK
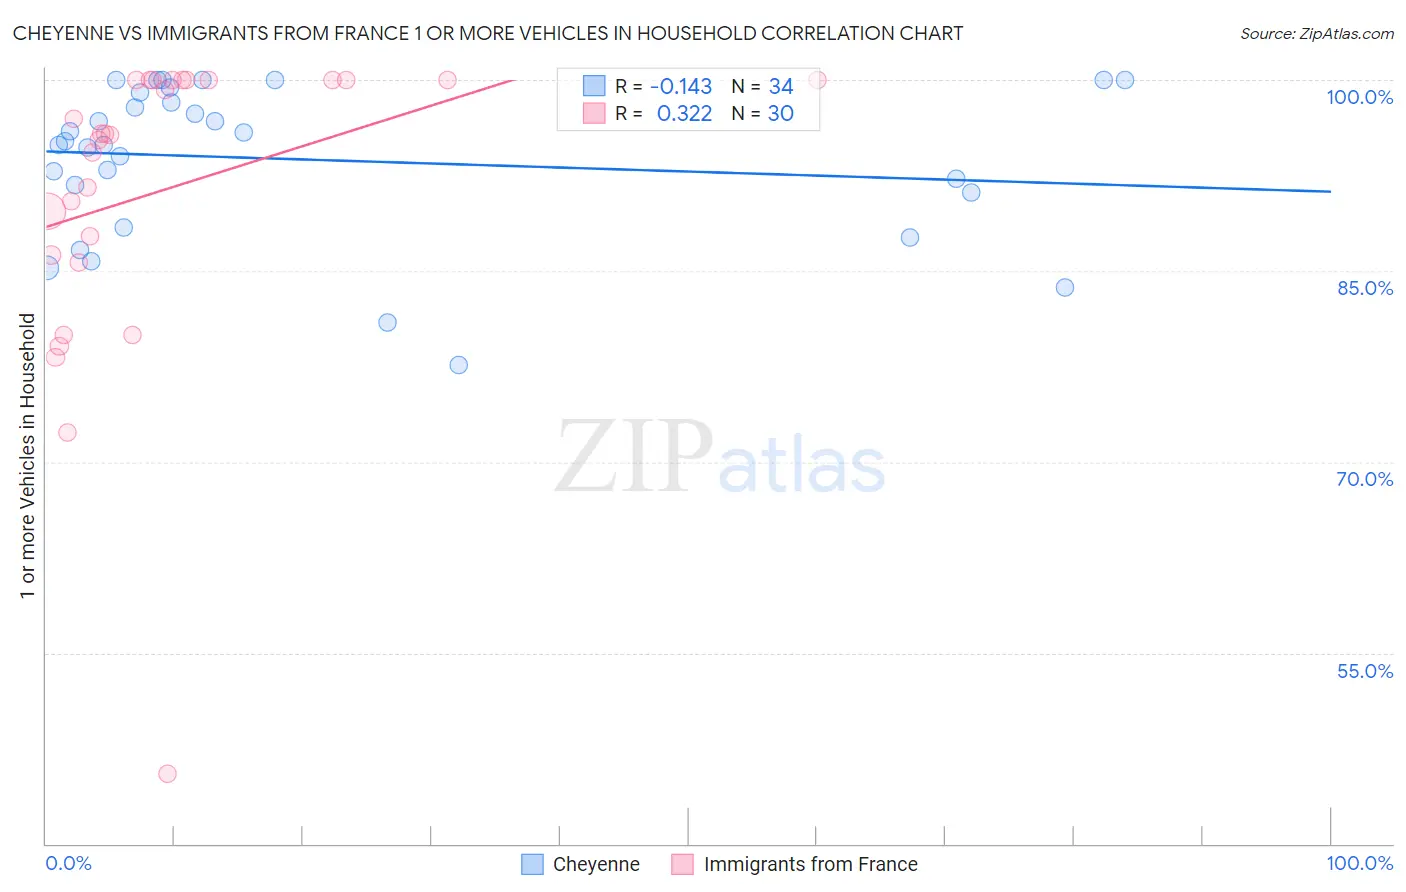
Cheyenne vs Immigrants from France 1 or more Vehicles in Household Correlation Chart
The statistical analysis conducted on geographies consisting of 80,710,429 people shows a poor negative correlation between the proportion of Cheyenne and percentage of households with 1 or more vehicles available in the United States with a correlation coefficient (R) of -0.143 and weighted average of 88.7%. Similarly, the statistical analysis conducted on geographies consisting of 287,832,397 people shows a mild positive correlation between the proportion of Immigrants from France and percentage of households with 1 or more vehicles available in the United States with a correlation coefficient (R) of 0.322 and weighted average of 87.1%, a difference of 1.8%.
1 or more Vehicles in Household Correlation Summary
| Measurement | Cheyenne | Immigrants from France |
| Minimum | 77.6% | 45.5% |
| Maximum | 100.0% | 100.0% |
| Range | 22.4% | 54.5% |
| Mean | 93.8% | 91.3% |
| Median | 95.1% | 95.7% |
| Interquartile 25% (IQ1) | 91.1% | 86.2% |
| Interquartile 75% (IQ3) | 99.1% | 100.0% |
| Interquartile Range (IQR) | 7.9% | 13.8% |
| Standard Deviation (Sample) | 6.0% | 11.9% |
| Standard Deviation (Population) | 6.0% | 11.7% |
Similar Demographics by 1 or more Vehicles in Household
Demographics Similar to Cheyenne by 1 or more Vehicles in Household
In terms of 1 or more vehicles in household, the demographic groups most similar to Cheyenne are Ute (88.7%, a difference of 0.0%), Immigrants from Norway (88.7%, a difference of 0.010%), Immigrants from Romania (88.7%, a difference of 0.020%), Cree (88.7%, a difference of 0.030%), and Immigrants from Hong Kong (88.7%, a difference of 0.040%).
| Demographics | Rating | Rank | 1 or more Vehicles in Household |
| Immigrants | Guatemala | 8.6 /100 | #219 | Tragic 88.9% |
| Immigrants | Zaire | 8.1 /100 | #220 | Tragic 88.8% |
| Peruvians | 7.9 /100 | #221 | Tragic 88.8% |
| Uruguayans | 7.0 /100 | #222 | Tragic 88.8% |
| Immigrants | South America | 7.0 /100 | #223 | Tragic 88.8% |
| Immigrants | Hong Kong | 6.2 /100 | #224 | Tragic 88.7% |
| Cree | 6.0 /100 | #225 | Tragic 88.7% |
| Cheyenne | 5.7 /100 | #226 | Tragic 88.7% |
| Ute | 5.6 /100 | #227 | Tragic 88.7% |
| Immigrants | Norway | 5.5 /100 | #228 | Tragic 88.7% |
| Immigrants | Romania | 5.4 /100 | #229 | Tragic 88.7% |
| Immigrants | Sierra Leone | 5.2 /100 | #230 | Tragic 88.7% |
| Russians | 5.0 /100 | #231 | Tragic 88.7% |
| Immigrants | Japan | 4.9 /100 | #232 | Tragic 88.7% |
| Houma | 4.8 /100 | #233 | Tragic 88.6% |
Demographics Similar to Immigrants from France by 1 or more Vehicles in Household
In terms of 1 or more vehicles in household, the demographic groups most similar to Immigrants from France are Alsatian (87.1%, a difference of 0.060%), Immigrants from Singapore (87.2%, a difference of 0.070%), Immigrants from Southern Europe (87.1%, a difference of 0.10%), Immigrants from Albania (87.1%, a difference of 0.10%), and Immigrants from Croatia (87.0%, a difference of 0.13%).
| Demographics | Rating | Rank | 1 or more Vehicles in Household |
| Immigrants | Africa | 0.2 /100 | #269 | Tragic 87.6% |
| Panamanians | 0.2 /100 | #270 | Tragic 87.5% |
| Bermudans | 0.2 /100 | #271 | Tragic 87.5% |
| Aleuts | 0.2 /100 | #272 | Tragic 87.5% |
| Immigrants | Northern Africa | 0.2 /100 | #273 | Tragic 87.4% |
| Immigrants | Morocco | 0.1 /100 | #274 | Tragic 87.4% |
| Immigrants | Singapore | 0.1 /100 | #275 | Tragic 87.2% |
| Immigrants | France | 0.1 /100 | #276 | Tragic 87.1% |
| Alsatians | 0.1 /100 | #277 | Tragic 87.1% |
| Immigrants | Southern Europe | 0.1 /100 | #278 | Tragic 87.1% |
| Immigrants | Albania | 0.1 /100 | #279 | Tragic 87.1% |
| Immigrants | Croatia | 0.0 /100 | #280 | Tragic 87.0% |
| Mongolians | 0.0 /100 | #281 | Tragic 87.0% |
| Colville | 0.0 /100 | #282 | Tragic 86.8% |
| Immigrants | Eastern Europe | 0.0 /100 | #283 | Tragic 86.7% |