British vs Ecuadorian 1 or more Vehicles in Household
COMPARE
British
Ecuadorian
1 or more Vehicles in Household
1 or more Vehicles in Household Comparison
British
Ecuadorians
92.5%
1 OR MORE VEHICLES IN HOUSEHOLD
100.0/ 100
METRIC RATING
26th/ 347
METRIC RANK
77.9%
1 OR MORE VEHICLES IN HOUSEHOLD
0.0/ 100
METRIC RATING
328th/ 347
METRIC RANK
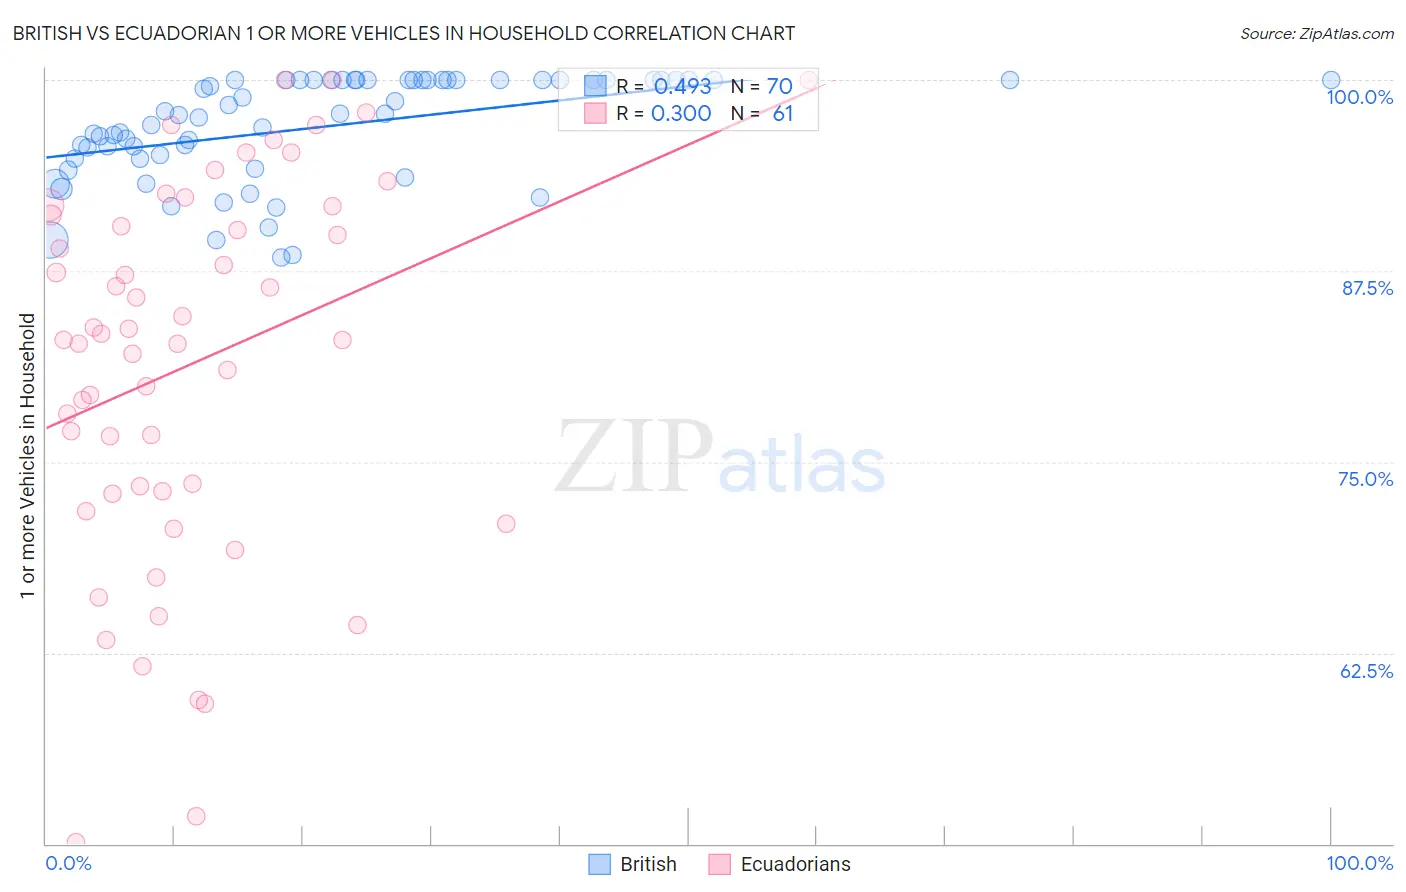
British vs Ecuadorian 1 or more Vehicles in Household Correlation Chart
The statistical analysis conducted on geographies consisting of 531,095,342 people shows a moderate positive correlation between the proportion of British and percentage of households with 1 or more vehicles available in the United States with a correlation coefficient (R) of 0.493 and weighted average of 92.5%. Similarly, the statistical analysis conducted on geographies consisting of 317,563,927 people shows a mild positive correlation between the proportion of Ecuadorians and percentage of households with 1 or more vehicles available in the United States with a correlation coefficient (R) of 0.300 and weighted average of 77.9%, a difference of 18.7%.
1 or more Vehicles in Household Correlation Summary
| Measurement | British | Ecuadorian |
| Minimum | 88.4% | 50.1% |
| Maximum | 100.0% | 100.0% |
| Range | 11.6% | 49.9% |
| Mean | 96.9% | 81.4% |
| Median | 97.8% | 83.0% |
| Interquartile 25% (IQ1) | 94.9% | 73.0% |
| Interquartile 75% (IQ3) | 100.0% | 91.4% |
| Interquartile Range (IQR) | 5.1% | 18.4% |
| Standard Deviation (Sample) | 3.4% | 12.3% |
| Standard Deviation (Population) | 3.4% | 12.2% |
Similar Demographics by 1 or more Vehicles in Household
Demographics Similar to British by 1 or more Vehicles in Household
In terms of 1 or more vehicles in household, the demographic groups most similar to British are Immigrants from Iraq (92.5%, a difference of 0.020%), Yaqui (92.6%, a difference of 0.040%), American (92.5%, a difference of 0.050%), Sri Lankan (92.5%, a difference of 0.080%), and Native Hawaiian (92.4%, a difference of 0.090%).
| Demographics | Rating | Rank | 1 or more Vehicles in Household |
| Tongans | 100.0 /100 | #19 | Exceptional 92.9% |
| Arapaho | 100.0 /100 | #20 | Exceptional 92.7% |
| Ottawa | 100.0 /100 | #21 | Exceptional 92.7% |
| French | 100.0 /100 | #22 | Exceptional 92.7% |
| Nepalese | 100.0 /100 | #23 | Exceptional 92.6% |
| Yaqui | 100.0 /100 | #24 | Exceptional 92.6% |
| Immigrants | Iraq | 100.0 /100 | #25 | Exceptional 92.5% |
| British | 100.0 /100 | #26 | Exceptional 92.5% |
| Americans | 100.0 /100 | #27 | Exceptional 92.5% |
| Sri Lankans | 100.0 /100 | #28 | Exceptional 92.5% |
| Native Hawaiians | 100.0 /100 | #29 | Exceptional 92.4% |
| Finns | 100.0 /100 | #30 | Exceptional 92.4% |
| Samoans | 100.0 /100 | #31 | Exceptional 92.4% |
| Basques | 100.0 /100 | #32 | Exceptional 92.4% |
| Cherokee | 100.0 /100 | #33 | Exceptional 92.4% |
Demographics Similar to Ecuadorians by 1 or more Vehicles in Household
In terms of 1 or more vehicles in household, the demographic groups most similar to Ecuadorians are Immigrants from Dominica (77.8%, a difference of 0.14%), Immigrants from Senegal (79.0%, a difference of 1.3%), Immigrants from Trinidad and Tobago (76.8%, a difference of 1.5%), Immigrants from West Indies (79.5%, a difference of 2.0%), and West Indian (76.4%, a difference of 2.1%).
| Demographics | Rating | Rank | 1 or more Vehicles in Household |
| Jamaicans | 0.0 /100 | #321 | Tragic 82.1% |
| Immigrants | Cabo Verde | 0.0 /100 | #322 | Tragic 81.6% |
| Immigrants | Yemen | 0.0 /100 | #323 | Tragic 80.5% |
| Immigrants | Caribbean | 0.0 /100 | #324 | Tragic 80.4% |
| Senegalese | 0.0 /100 | #325 | Tragic 80.4% |
| Immigrants | West Indies | 0.0 /100 | #326 | Tragic 79.5% |
| Immigrants | Senegal | 0.0 /100 | #327 | Tragic 79.0% |
| Ecuadorians | 0.0 /100 | #328 | Tragic 77.9% |
| Immigrants | Dominica | 0.0 /100 | #329 | Tragic 77.8% |
| Immigrants | Trinidad and Tobago | 0.0 /100 | #330 | Tragic 76.8% |
| West Indians | 0.0 /100 | #331 | Tragic 76.4% |
| Trinidadians and Tobagonians | 0.0 /100 | #332 | Tragic 76.3% |
| Immigrants | Ecuador | 0.0 /100 | #333 | Tragic 76.2% |
| Immigrants | Bangladesh | 0.0 /100 | #334 | Tragic 74.3% |
| Barbadians | 0.0 /100 | #335 | Tragic 74.0% |