British vs Chippewa 1 or more Vehicles in Household
COMPARE
British
Chippewa
1 or more Vehicles in Household
1 or more Vehicles in Household Comparison
British
Chippewa
92.5%
1 OR MORE VEHICLES IN HOUSEHOLD
100.0/ 100
METRIC RATING
26th/ 347
METRIC RANK
90.7%
1 OR MORE VEHICLES IN HOUSEHOLD
94.3/ 100
METRIC RATING
116th/ 347
METRIC RANK
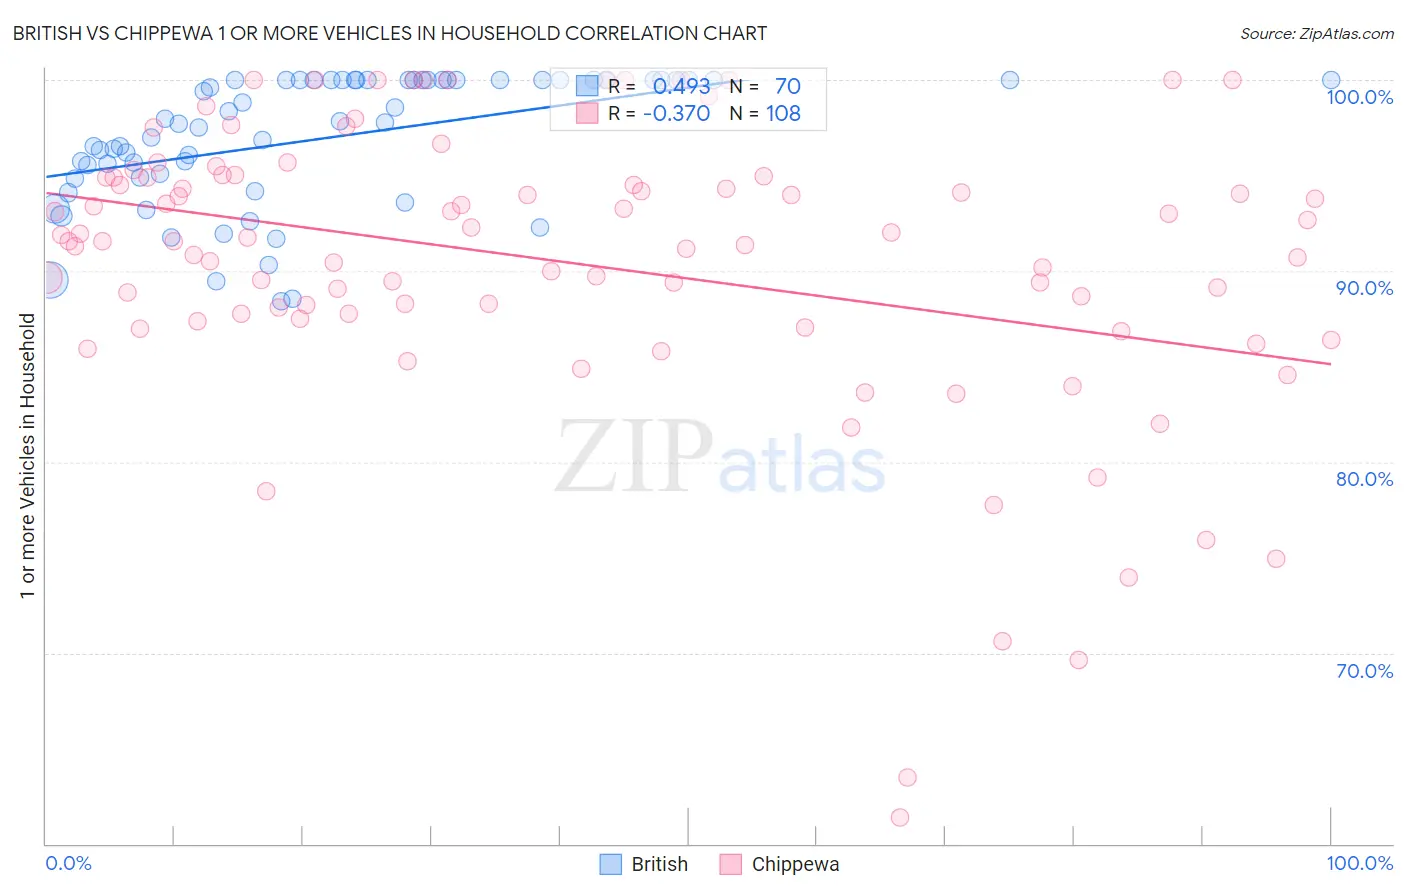
British vs Chippewa 1 or more Vehicles in Household Correlation Chart
The statistical analysis conducted on geographies consisting of 531,095,342 people shows a moderate positive correlation between the proportion of British and percentage of households with 1 or more vehicles available in the United States with a correlation coefficient (R) of 0.493 and weighted average of 92.5%. Similarly, the statistical analysis conducted on geographies consisting of 215,015,305 people shows a mild negative correlation between the proportion of Chippewa and percentage of households with 1 or more vehicles available in the United States with a correlation coefficient (R) of -0.370 and weighted average of 90.7%, a difference of 2.1%.
1 or more Vehicles in Household Correlation Summary
| Measurement | British | Chippewa |
| Minimum | 88.4% | 61.4% |
| Maximum | 100.0% | 100.0% |
| Range | 11.6% | 38.6% |
| Mean | 96.9% | 90.4% |
| Median | 97.8% | 91.5% |
| Interquartile 25% (IQ1) | 94.9% | 87.6% |
| Interquartile 75% (IQ3) | 100.0% | 94.9% |
| Interquartile Range (IQR) | 5.1% | 7.3% |
| Standard Deviation (Sample) | 3.4% | 7.5% |
| Standard Deviation (Population) | 3.4% | 7.5% |
Similar Demographics by 1 or more Vehicles in Household
Demographics Similar to British by 1 or more Vehicles in Household
In terms of 1 or more vehicles in household, the demographic groups most similar to British are Immigrants from Iraq (92.5%, a difference of 0.020%), Yaqui (92.6%, a difference of 0.040%), American (92.5%, a difference of 0.050%), Sri Lankan (92.5%, a difference of 0.080%), and Native Hawaiian (92.4%, a difference of 0.090%).
| Demographics | Rating | Rank | 1 or more Vehicles in Household |
| Tongans | 100.0 /100 | #19 | Exceptional 92.9% |
| Arapaho | 100.0 /100 | #20 | Exceptional 92.7% |
| Ottawa | 100.0 /100 | #21 | Exceptional 92.7% |
| French | 100.0 /100 | #22 | Exceptional 92.7% |
| Nepalese | 100.0 /100 | #23 | Exceptional 92.6% |
| Yaqui | 100.0 /100 | #24 | Exceptional 92.6% |
| Immigrants | Iraq | 100.0 /100 | #25 | Exceptional 92.5% |
| British | 100.0 /100 | #26 | Exceptional 92.5% |
| Americans | 100.0 /100 | #27 | Exceptional 92.5% |
| Sri Lankans | 100.0 /100 | #28 | Exceptional 92.5% |
| Native Hawaiians | 100.0 /100 | #29 | Exceptional 92.4% |
| Finns | 100.0 /100 | #30 | Exceptional 92.4% |
| Samoans | 100.0 /100 | #31 | Exceptional 92.4% |
| Basques | 100.0 /100 | #32 | Exceptional 92.4% |
| Cherokee | 100.0 /100 | #33 | Exceptional 92.4% |
Demographics Similar to Chippewa by 1 or more Vehicles in Household
In terms of 1 or more vehicles in household, the demographic groups most similar to Chippewa are Serbian (90.7%, a difference of 0.0%), Armenian (90.7%, a difference of 0.020%), Immigrants from Kuwait (90.7%, a difference of 0.030%), Greek (90.6%, a difference of 0.050%), and Japanese (90.6%, a difference of 0.060%).
| Demographics | Rating | Rank | 1 or more Vehicles in Household |
| Delaware | 97.6 /100 | #109 | Exceptional 91.0% |
| Mexican American Indians | 97.4 /100 | #110 | Exceptional 91.0% |
| Navajo | 95.8 /100 | #111 | Exceptional 90.8% |
| Immigrants | Netherlands | 95.7 /100 | #112 | Exceptional 90.8% |
| Immigrants | Kuwait | 94.7 /100 | #113 | Exceptional 90.7% |
| Armenians | 94.5 /100 | #114 | Exceptional 90.7% |
| Serbians | 94.3 /100 | #115 | Exceptional 90.7% |
| Chippewa | 94.3 /100 | #116 | Exceptional 90.7% |
| Greeks | 93.5 /100 | #117 | Exceptional 90.6% |
| Japanese | 93.4 /100 | #118 | Exceptional 90.6% |
| Blackfeet | 92.6 /100 | #119 | Exceptional 90.6% |
| Immigrants | Thailand | 92.3 /100 | #120 | Exceptional 90.6% |
| Icelanders | 92.1 /100 | #121 | Exceptional 90.5% |
| Costa Ricans | 92.0 /100 | #122 | Exceptional 90.5% |
| Fijians | 91.8 /100 | #123 | Exceptional 90.5% |