Black/African American vs Immigrants from Norway Single Father Households
COMPARE
Black/African American
Immigrants from Norway
Single Father Households
Single Father Households Comparison
Blacks/African Americans
Immigrants from Norway
2.4%
SINGLE FATHER HOUSEHOLDS
9.7/ 100
METRIC RATING
226th/ 347
METRIC RANK
2.0%
SINGLE FATHER HOUSEHOLDS
99.9/ 100
METRIC RATING
56th/ 347
METRIC RANK
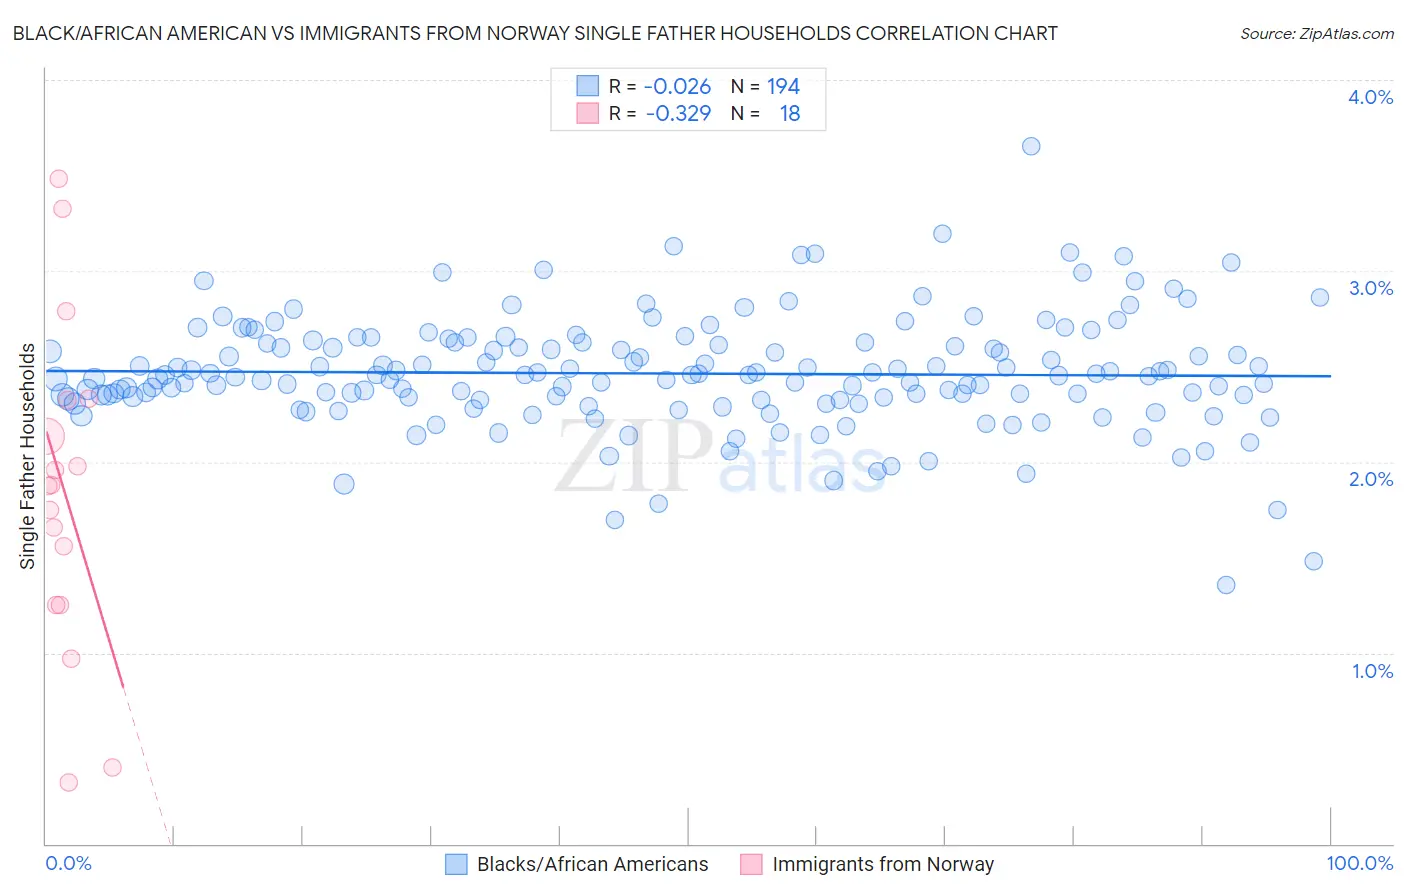
Black/African American vs Immigrants from Norway Single Father Households Correlation Chart
The statistical analysis conducted on geographies consisting of 552,512,239 people shows no correlation between the proportion of Blacks/African Americans and percentage of single father households in the United States with a correlation coefficient (R) of -0.026 and weighted average of 2.4%. Similarly, the statistical analysis conducted on geographies consisting of 116,272,721 people shows a mild negative correlation between the proportion of Immigrants from Norway and percentage of single father households in the United States with a correlation coefficient (R) of -0.329 and weighted average of 2.0%, a difference of 20.0%.
Single Father Households Correlation Summary
| Measurement | Black/African American | Immigrants from Norway |
| Minimum | 1.4% | 0.32% |
| Maximum | 3.7% | 3.5% |
| Range | 2.3% | 3.2% |
| Mean | 2.5% | 1.8% |
| Median | 2.5% | 1.9% |
| Interquartile 25% (IQ1) | 2.3% | 1.3% |
| Interquartile 75% (IQ3) | 2.6% | 2.3% |
| Interquartile Range (IQR) | 0.30% | 1.1% |
| Standard Deviation (Sample) | 0.30% | 0.85% |
| Standard Deviation (Population) | 0.30% | 0.83% |
Similar Demographics by Single Father Households
Demographics Similar to Blacks/African Americans by Single Father Households
In terms of single father households, the demographic groups most similar to Blacks/African Americans are Marshallese (2.4%, a difference of 0.010%), American (2.4%, a difference of 0.070%), Immigrants from Ghana (2.4%, a difference of 0.11%), Immigrants from Bahamas (2.4%, a difference of 0.19%), and Immigrants from Zaire (2.4%, a difference of 0.21%).
| Demographics | Rating | Rank | Single Father Households |
| Sudanese | 13.0 /100 | #219 | Poor 2.4% |
| Ghanaians | 12.9 /100 | #220 | Poor 2.4% |
| Immigrants | Burma/Myanmar | 12.1 /100 | #221 | Poor 2.4% |
| Immigrants | Eastern Africa | 11.9 /100 | #222 | Poor 2.4% |
| Immigrants | Uruguay | 11.0 /100 | #223 | Poor 2.4% |
| Immigrants | Bahamas | 10.6 /100 | #224 | Poor 2.4% |
| Marshallese | 9.7 /100 | #225 | Tragic 2.4% |
| Blacks/African Americans | 9.7 /100 | #226 | Tragic 2.4% |
| Americans | 9.3 /100 | #227 | Tragic 2.4% |
| Immigrants | Ghana | 9.1 /100 | #228 | Tragic 2.4% |
| Immigrants | Zaire | 8.6 /100 | #229 | Tragic 2.4% |
| Sub-Saharan Africans | 8.3 /100 | #230 | Tragic 2.4% |
| Immigrants | Nonimmigrants | 7.6 /100 | #231 | Tragic 2.4% |
| Pennsylvania Germans | 7.3 /100 | #232 | Tragic 2.4% |
| Immigrants | Western Africa | 7.0 /100 | #233 | Tragic 2.4% |
Demographics Similar to Immigrants from Norway by Single Father Households
In terms of single father households, the demographic groups most similar to Immigrants from Norway are Immigrants from France (2.0%, a difference of 0.020%), Immigrants from Korea (2.0%, a difference of 0.080%), Immigrants from Northern Europe (2.0%, a difference of 0.22%), Burmese (2.0%, a difference of 0.26%), and Immigrants from Czechoslovakia (2.0%, a difference of 0.29%).
| Demographics | Rating | Rank | Single Father Households |
| Immigrants | Serbia | 99.9 /100 | #49 | Exceptional 2.0% |
| Immigrants | Switzerland | 99.9 /100 | #50 | Exceptional 2.0% |
| Immigrants | Poland | 99.9 /100 | #51 | Exceptional 2.0% |
| Immigrants | Europe | 99.9 /100 | #52 | Exceptional 2.0% |
| Immigrants | Northern Europe | 99.9 /100 | #53 | Exceptional 2.0% |
| Immigrants | Korea | 99.9 /100 | #54 | Exceptional 2.0% |
| Immigrants | France | 99.9 /100 | #55 | Exceptional 2.0% |
| Immigrants | Norway | 99.9 /100 | #56 | Exceptional 2.0% |
| Burmese | 99.9 /100 | #57 | Exceptional 2.0% |
| Immigrants | Czechoslovakia | 99.9 /100 | #58 | Exceptional 2.0% |
| Immigrants | North Macedonia | 99.9 /100 | #59 | Exceptional 2.0% |
| Immigrants | Austria | 99.9 /100 | #60 | Exceptional 2.0% |
| Vietnamese | 99.9 /100 | #61 | Exceptional 2.0% |
| Immigrants | Malaysia | 99.9 /100 | #62 | Exceptional 2.0% |
| Maltese | 99.9 /100 | #63 | Exceptional 2.0% |