Black/African American vs Immigrants from Norway Unemployment Among Ages 35 to 44 years
COMPARE
Black/African American
Immigrants from Norway
Unemployment Among Ages 35 to 44 years
Unemployment Among Ages 35 to 44 years Comparison
Blacks/African Americans
Immigrants from Norway
6.1%
UNEMPLOYMENT AMONG AGES 35 TO 44 YEARS
0.0/ 100
METRIC RATING
315th/ 347
METRIC RANK
4.6%
UNEMPLOYMENT AMONG AGES 35 TO 44 YEARS
77.5/ 100
METRIC RATING
138th/ 347
METRIC RANK
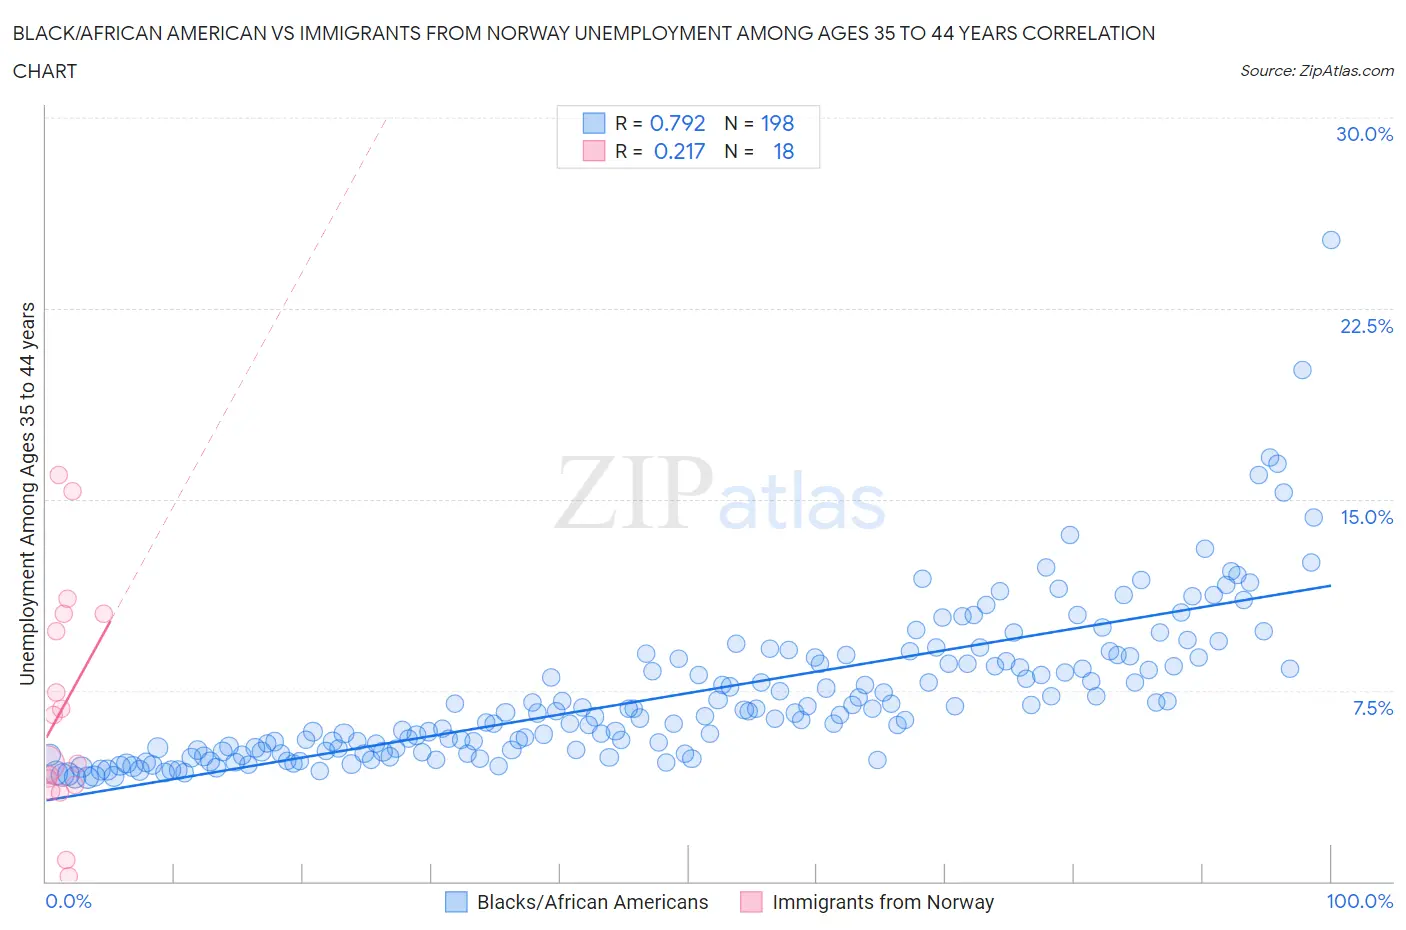
Black/African American vs Immigrants from Norway Unemployment Among Ages 35 to 44 years Correlation Chart
The statistical analysis conducted on geographies consisting of 531,599,324 people shows a strong positive correlation between the proportion of Blacks/African Americans and unemployment rate among population between the ages 35 and 44 in the United States with a correlation coefficient (R) of 0.792 and weighted average of 6.1%. Similarly, the statistical analysis conducted on geographies consisting of 115,659,924 people shows a weak positive correlation between the proportion of Immigrants from Norway and unemployment rate among population between the ages 35 and 44 in the United States with a correlation coefficient (R) of 0.217 and weighted average of 4.6%, a difference of 33.1%.
Unemployment Among Ages 35 to 44 years Correlation Summary
| Measurement | Black/African American | Immigrants from Norway |
| Minimum | 4.1% | 0.20% |
| Maximum | 25.2% | 16.0% |
| Range | 21.1% | 15.8% |
| Mean | 7.4% | 6.8% |
| Median | 6.6% | 5.6% |
| Interquartile 25% (IQ1) | 5.1% | 3.8% |
| Interquartile 75% (IQ3) | 8.7% | 10.5% |
| Interquartile Range (IQR) | 3.6% | 6.7% |
| Standard Deviation (Sample) | 3.1% | 4.5% |
| Standard Deviation (Population) | 3.0% | 4.4% |
Similar Demographics by Unemployment Among Ages 35 to 44 years
Demographics Similar to Blacks/African Americans by Unemployment Among Ages 35 to 44 years
In terms of unemployment among ages 35 to 44 years, the demographic groups most similar to Blacks/African Americans are Tsimshian (6.2%, a difference of 0.85%), Immigrants from St. Vincent and the Grenadines (6.2%, a difference of 1.0%), Colville (6.2%, a difference of 1.5%), Immigrants from Grenada (6.2%, a difference of 1.7%), and Immigrants from Dominica (6.0%, a difference of 1.8%).
| Demographics | Rating | Rank | Unemployment Among Ages 35 to 44 years |
| Immigrants | Azores | 0.0 /100 | #308 | Tragic 5.8% |
| Immigrants | Barbados | 0.0 /100 | #309 | Tragic 5.8% |
| Guyanese | 0.0 /100 | #310 | Tragic 5.9% |
| Marshallese | 0.0 /100 | #311 | Tragic 5.9% |
| Immigrants | Guyana | 0.0 /100 | #312 | Tragic 6.0% |
| British West Indians | 0.0 /100 | #313 | Tragic 6.0% |
| Immigrants | Dominica | 0.0 /100 | #314 | Tragic 6.0% |
| Blacks/African Americans | 0.0 /100 | #315 | Tragic 6.1% |
| Tsimshian | 0.0 /100 | #316 | Tragic 6.2% |
| Immigrants | St. Vincent and the Grenadines | 0.0 /100 | #317 | Tragic 6.2% |
| Colville | 0.0 /100 | #318 | Tragic 6.2% |
| Immigrants | Grenada | 0.0 /100 | #319 | Tragic 6.2% |
| Immigrants | Armenia | 0.0 /100 | #320 | Tragic 6.2% |
| Chippewa | 0.0 /100 | #321 | Tragic 6.2% |
| Immigrants | Dominican Republic | 0.0 /100 | #322 | Tragic 6.4% |
Demographics Similar to Immigrants from Norway by Unemployment Among Ages 35 to 44 years
In terms of unemployment among ages 35 to 44 years, the demographic groups most similar to Immigrants from Norway are Immigrants from Hungary (4.6%, a difference of 0.12%), Immigrants from Iraq (4.6%, a difference of 0.15%), Immigrants from Eastern Africa (4.6%, a difference of 0.15%), Canadian (4.6%, a difference of 0.16%), and Ukrainian (4.6%, a difference of 0.17%).
| Demographics | Rating | Rank | Unemployment Among Ages 35 to 44 years |
| Immigrants | Colombia | 82.6 /100 | #131 | Excellent 4.6% |
| Colombians | 80.8 /100 | #132 | Excellent 4.6% |
| Syrians | 80.7 /100 | #133 | Excellent 4.6% |
| Laotians | 80.1 /100 | #134 | Excellent 4.6% |
| Immigrants | Europe | 79.4 /100 | #135 | Good 4.6% |
| Scotch-Irish | 79.3 /100 | #136 | Good 4.6% |
| Immigrants | Iraq | 78.9 /100 | #137 | Good 4.6% |
| Immigrants | Norway | 77.5 /100 | #138 | Good 4.6% |
| Immigrants | Hungary | 76.3 /100 | #139 | Good 4.6% |
| Immigrants | Eastern Africa | 76.0 /100 | #140 | Good 4.6% |
| Canadians | 75.9 /100 | #141 | Good 4.6% |
| Ukrainians | 75.8 /100 | #142 | Good 4.6% |
| Immigrants | Switzerland | 75.5 /100 | #143 | Good 4.6% |
| Immigrants | Russia | 75.4 /100 | #144 | Good 4.6% |
| Immigrants | Eastern Europe | 74.7 /100 | #145 | Good 4.6% |