Black/African American vs Immigrants 4 or more Vehicles in Household
COMPARE
Black/African American
Immigrants
4 or more Vehicles in Household
4 or more Vehicles in Household Comparison
Blacks/African Americans
Immigrants
5.5%
4 OR MORE VEHICLES IN HOUSEHOLD
0.6/ 100
METRIC RATING
274th/ 347
METRIC RANK
6.8%
4 OR MORE VEHICLES IN HOUSEHOLD
94.6/ 100
METRIC RATING
123rd/ 347
METRIC RANK
Black/African American vs Immigrants 4 or more Vehicles in Household Correlation Chart
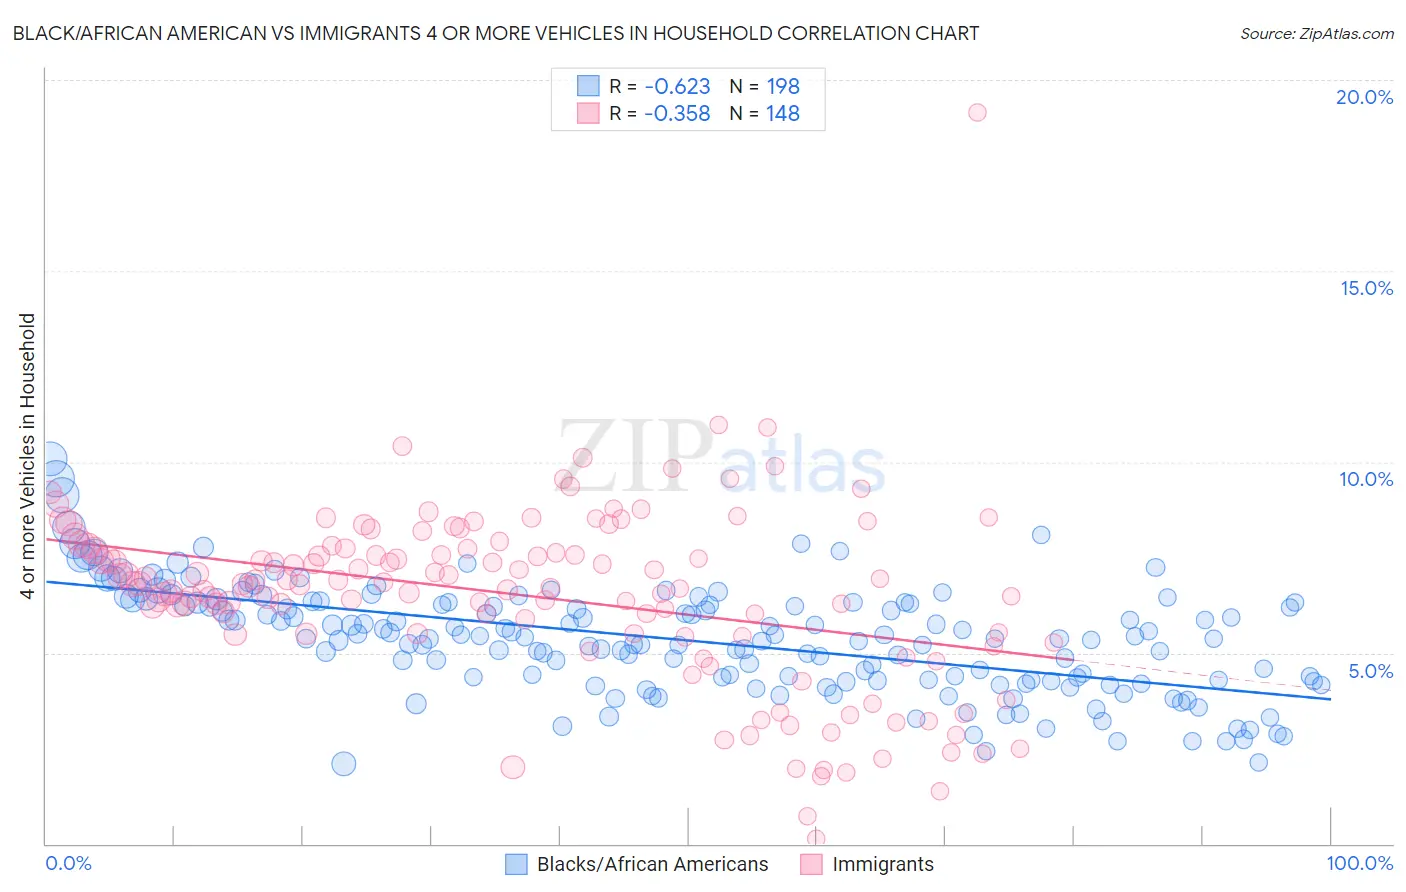
The statistical analysis conducted on geographies consisting of 562,244,951 people shows a significant negative correlation between the proportion of Blacks/African Americans and percentage of households with 4 or more vehicles available in the United States with a correlation coefficient (R) of -0.623 and weighted average of 5.5%. Similarly, the statistical analysis conducted on geographies consisting of 573,807,662 people shows a mild negative correlation between the proportion of Immigrants and percentage of households with 4 or more vehicles available in the United States with a correlation coefficient (R) of -0.358 and weighted average of 6.8%, a difference of 23.4%.
4 or more Vehicles in Household Correlation Summary
| Measurement | Black/African American | Immigrants |
| Minimum | 2.1% | 0.13% |
| Maximum | 10.1% | 19.1% |
| Range | 8.0% | 19.0% |
| Mean | 5.3% | 6.5% |
| Median | 5.4% | 6.8% |
| Interquartile 25% (IQ1) | 4.3% | 5.5% |
| Interquartile 75% (IQ3) | 6.3% | 7.8% |
| Interquartile Range (IQR) | 2.0% | 2.3% |
| Standard Deviation (Sample) | 1.4% | 2.4% |
| Standard Deviation (Population) | 1.4% | 2.4% |
Similar Demographics by 4 or more Vehicles in Household
Demographics Similar to Blacks/African Americans by 4 or more Vehicles in Household
In terms of 4 or more vehicles in household, the demographic groups most similar to Blacks/African Americans are Macedonian (5.5%, a difference of 0.12%), Cambodian (5.5%, a difference of 0.12%), Immigrants from Latvia (5.5%, a difference of 0.13%), Immigrants from Kazakhstan (5.5%, a difference of 0.15%), and Immigrants from Bulgaria (5.5%, a difference of 0.25%).
| Demographics | Rating | Rank | 4 or more Vehicles in Household |
| Immigrants | Ukraine | 0.9 /100 | #267 | Tragic 5.6% |
| Colombians | 0.7 /100 | #268 | Tragic 5.5% |
| Carpatho Rusyns | 0.7 /100 | #269 | Tragic 5.5% |
| Okinawans | 0.6 /100 | #270 | Tragic 5.5% |
| Immigrants | Sudan | 0.6 /100 | #271 | Tragic 5.5% |
| Immigrants | Kazakhstan | 0.6 /100 | #272 | Tragic 5.5% |
| Macedonians | 0.6 /100 | #273 | Tragic 5.5% |
| Blacks/African Americans | 0.6 /100 | #274 | Tragic 5.5% |
| Cambodians | 0.5 /100 | #275 | Tragic 5.5% |
| Immigrants | Latvia | 0.5 /100 | #276 | Tragic 5.5% |
| Immigrants | Bulgaria | 0.5 /100 | #277 | Tragic 5.5% |
| Immigrants | Eastern Europe | 0.4 /100 | #278 | Tragic 5.4% |
| Immigrants | Uruguay | 0.3 /100 | #279 | Tragic 5.4% |
| Alsatians | 0.3 /100 | #280 | Tragic 5.4% |
| Immigrants | Western Africa | 0.3 /100 | #281 | Tragic 5.4% |
Demographics Similar to Immigrants by 4 or more Vehicles in Household
In terms of 4 or more vehicles in household, the demographic groups most similar to Immigrants are Immigrants from Nicaragua (6.8%, a difference of 0.060%), Immigrants from Germany (6.8%, a difference of 0.070%), Immigrants from Asia (6.8%, a difference of 0.10%), Comanche (6.8%, a difference of 0.13%), and Austrian (6.8%, a difference of 0.19%).
| Demographics | Rating | Rank | 4 or more Vehicles in Household |
| Immigrants | Guatemala | 95.8 /100 | #116 | Exceptional 6.8% |
| Burmese | 95.7 /100 | #117 | Exceptional 6.8% |
| French American Indians | 95.7 /100 | #118 | Exceptional 6.8% |
| Costa Ricans | 95.5 /100 | #119 | Exceptional 6.8% |
| Comanche | 94.8 /100 | #120 | Exceptional 6.8% |
| Immigrants | Germany | 94.7 /100 | #121 | Exceptional 6.8% |
| Immigrants | Nicaragua | 94.7 /100 | #122 | Exceptional 6.8% |
| Immigrants | Immigrants | 94.6 /100 | #123 | Exceptional 6.8% |
| Immigrants | Asia | 94.4 /100 | #124 | Exceptional 6.8% |
| Austrians | 94.1 /100 | #125 | Exceptional 6.8% |
| Belgians | 94.1 /100 | #126 | Exceptional 6.8% |
| Immigrants | Korea | 93.8 /100 | #127 | Exceptional 6.8% |
| Immigrants | Bolivia | 92.5 /100 | #128 | Exceptional 6.7% |
| Immigrants | England | 92.0 /100 | #129 | Exceptional 6.7% |
| Immigrants | Scotland | 89.0 /100 | #130 | Excellent 6.7% |