Belgian vs Arab Hearing Disability
COMPARE
Belgian
Arab
Hearing Disability
Hearing Disability Comparison
Belgians
Arabs
3.5%
HEARING DISABILITY
0.1/ 100
METRIC RATING
266th/ 347
METRIC RANK
3.0%
HEARING DISABILITY
57.6/ 100
METRIC RATING
169th/ 347
METRIC RANK
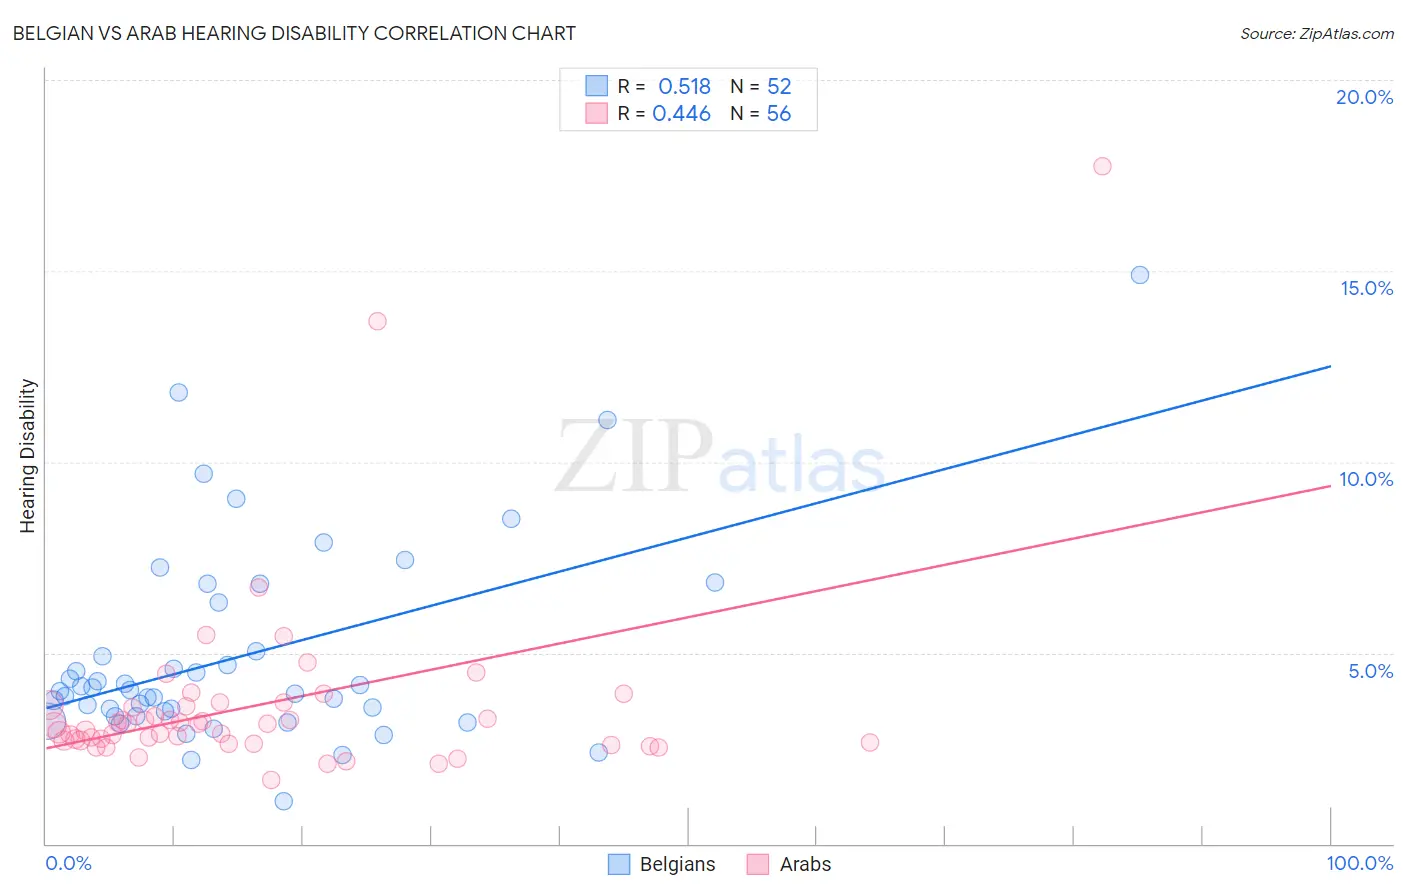
Belgian vs Arab Hearing Disability Correlation Chart
The statistical analysis conducted on geographies consisting of 355,952,409 people shows a substantial positive correlation between the proportion of Belgians and percentage of population with hearing disability in the United States with a correlation coefficient (R) of 0.518 and weighted average of 3.5%. Similarly, the statistical analysis conducted on geographies consisting of 486,579,834 people shows a moderate positive correlation between the proportion of Arabs and percentage of population with hearing disability in the United States with a correlation coefficient (R) of 0.446 and weighted average of 3.0%, a difference of 17.1%.
Hearing Disability Correlation Summary
| Measurement | Belgian | Arab |
| Minimum | 1.1% | 1.7% |
| Maximum | 14.9% | 17.8% |
| Range | 13.8% | 16.1% |
| Mean | 4.9% | 3.6% |
| Median | 4.0% | 3.1% |
| Interquartile 25% (IQ1) | 3.4% | 2.7% |
| Interquartile 75% (IQ3) | 5.7% | 3.6% |
| Interquartile Range (IQR) | 2.3% | 0.96% |
| Standard Deviation (Sample) | 2.7% | 2.5% |
| Standard Deviation (Population) | 2.6% | 2.5% |
Similar Demographics by Hearing Disability
Demographics Similar to Belgians by Hearing Disability
In terms of hearing disability, the demographic groups most similar to Belgians are British (3.5%, a difference of 0.18%), Immigrants from Germany (3.5%, a difference of 0.20%), Canadian (3.5%, a difference of 0.22%), Spaniard (3.5%, a difference of 0.24%), and Immigrants from Canada (3.5%, a difference of 0.42%).
| Demographics | Rating | Rank | Hearing Disability |
| Slovenes | 0.1 /100 | #259 | Tragic 3.5% |
| Portuguese | 0.1 /100 | #260 | Tragic 3.5% |
| Hawaiians | 0.1 /100 | #261 | Tragic 3.5% |
| Immigrants | North America | 0.1 /100 | #262 | Tragic 3.5% |
| Immigrants | Canada | 0.1 /100 | #263 | Tragic 3.5% |
| Immigrants | Germany | 0.1 /100 | #264 | Tragic 3.5% |
| British | 0.1 /100 | #265 | Tragic 3.5% |
| Belgians | 0.1 /100 | #266 | Tragic 3.5% |
| Canadians | 0.1 /100 | #267 | Tragic 3.5% |
| Spaniards | 0.1 /100 | #268 | Tragic 3.5% |
| Ute | 0.1 /100 | #269 | Tragic 3.5% |
| Europeans | 0.1 /100 | #270 | Tragic 3.5% |
| Czechs | 0.1 /100 | #271 | Tragic 3.5% |
| Fijians | 0.0 /100 | #272 | Tragic 3.5% |
| Puerto Ricans | 0.0 /100 | #273 | Tragic 3.5% |
Demographics Similar to Arabs by Hearing Disability
In terms of hearing disability, the demographic groups most similar to Arabs are Immigrants from Greece (3.0%, a difference of 0.030%), Immigrants from Eastern Europe (3.0%, a difference of 0.040%), Immigrants from Cabo Verde (3.0%, a difference of 0.070%), Immigrants from Ukraine (3.0%, a difference of 0.10%), and Armenian (3.0%, a difference of 0.15%).
| Demographics | Rating | Rank | Hearing Disability |
| Immigrants | Japan | 66.3 /100 | #162 | Good 2.9% |
| Immigrants | Central America | 64.9 /100 | #163 | Good 3.0% |
| Immigrants | Cambodia | 64.8 /100 | #164 | Good 3.0% |
| Immigrants | Zimbabwe | 64.2 /100 | #165 | Good 3.0% |
| Immigrants | South Eastern Asia | 62.9 /100 | #166 | Good 3.0% |
| Immigrants | Eastern Europe | 58.1 /100 | #167 | Average 3.0% |
| Immigrants | Greece | 57.9 /100 | #168 | Average 3.0% |
| Arabs | 57.6 /100 | #169 | Average 3.0% |
| Immigrants | Cabo Verde | 56.9 /100 | #170 | Average 3.0% |
| Immigrants | Ukraine | 56.6 /100 | #171 | Average 3.0% |
| Armenians | 56.0 /100 | #172 | Average 3.0% |
| Immigrants | Serbia | 51.1 /100 | #173 | Average 3.0% |
| Indonesians | 50.0 /100 | #174 | Average 3.0% |
| Immigrants | Romania | 48.4 /100 | #175 | Average 3.0% |
| Panamanians | 47.0 /100 | #176 | Average 3.0% |