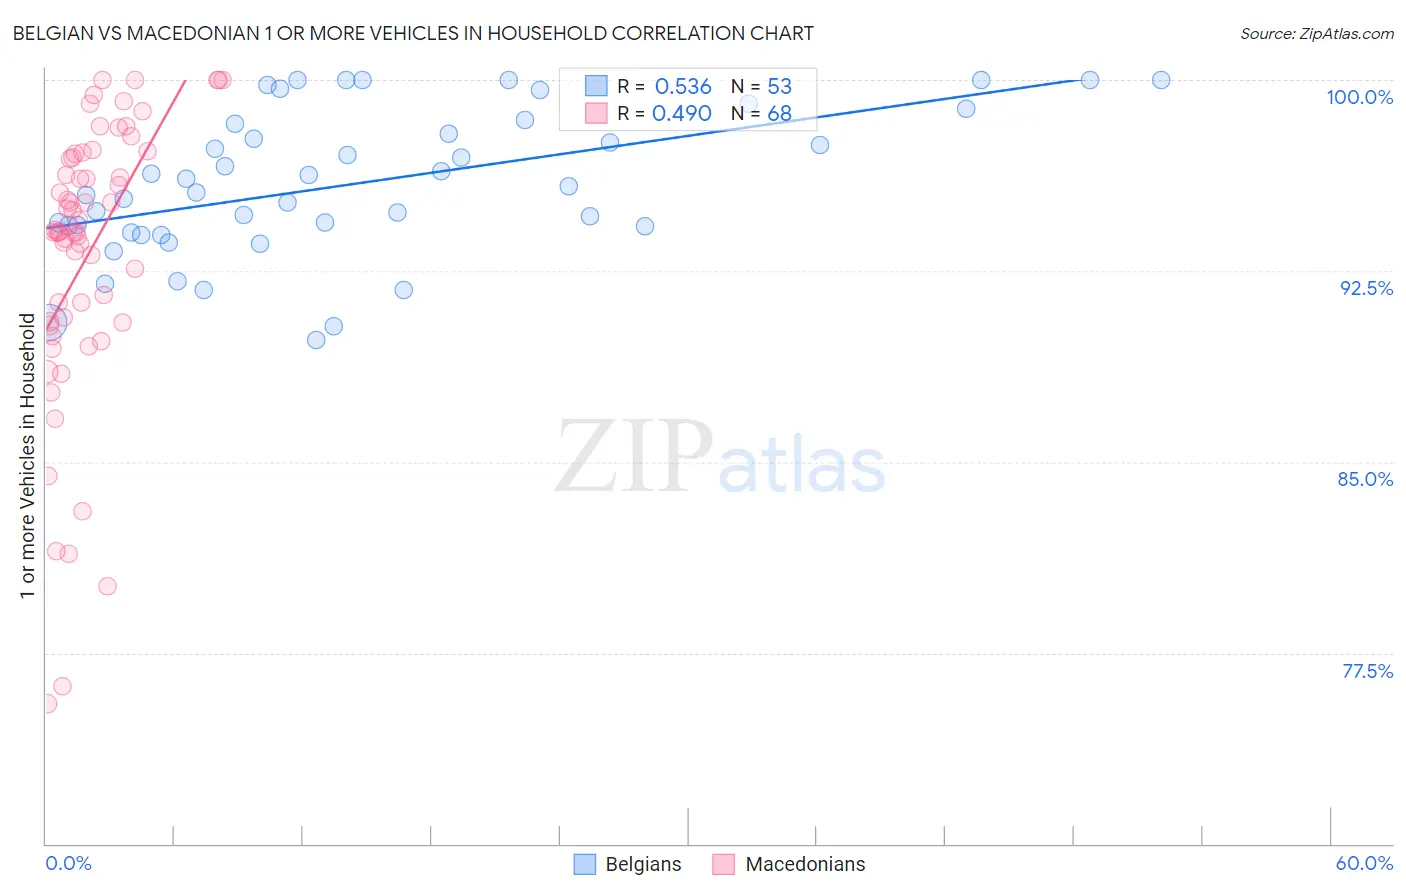
Belgian vs Macedonian 1 or more Vehicles in Household
COMPARE
Belgian
Macedonian
1 or more Vehicles in Household
1 or more Vehicles in Household Comparison
Belgians
Macedonians
92.1%
1 OR MORE VEHICLES IN HOUSEHOLD
99.9/ 100
METRIC RATING
48th/ 347
METRIC RANK
87.9%
1 OR MORE VEHICLES IN HOUSEHOLD
0.6/ 100
METRIC RATING
260th/ 347
METRIC RANK
Belgian vs Macedonian 1 or more Vehicles in Household Correlation Chart
The statistical analysis conducted on geographies consisting of 355,873,468 people shows a substantial positive correlation between the proportion of Belgians and percentage of households with 1 or more vehicles available in the United States with a correlation coefficient (R) of 0.536 and weighted average of 92.1%. Similarly, the statistical analysis conducted on geographies consisting of 132,543,746 people shows a moderate positive correlation between the proportion of Macedonians and percentage of households with 1 or more vehicles available in the United States with a correlation coefficient (R) of 0.490 and weighted average of 87.9%, a difference of 4.8%.
1 or more Vehicles in Household Correlation Summary
| Measurement | Belgian | Macedonian |
| Minimum | 89.8% | 75.5% |
| Maximum | 100.0% | 100.0% |
| Range | 10.2% | 24.5% |
| Mean | 96.0% | 93.1% |
| Median | 95.8% | 94.0% |
| Interquartile 25% (IQ1) | 94.1% | 90.5% |
| Interquartile 75% (IQ3) | 98.3% | 97.0% |
| Interquartile Range (IQR) | 4.2% | 6.6% |
| Standard Deviation (Sample) | 2.8% | 5.6% |
| Standard Deviation (Population) | 2.8% | 5.5% |
Similar Demographics by 1 or more Vehicles in Household
Demographics Similar to Belgians by 1 or more Vehicles in Household
In terms of 1 or more vehicles in household, the demographic groups most similar to Belgians are Afghan (92.1%, a difference of 0.010%), Guamanian/Chamorro (92.1%, a difference of 0.020%), Celtic (92.1%, a difference of 0.030%), Korean (92.1%, a difference of 0.060%), and Immigrants from Fiji (92.2%, a difference of 0.090%).
| Demographics | Rating | Rank | 1 or more Vehicles in Household |
| Immigrants | Taiwan | 99.9 /100 | #41 | Exceptional 92.3% |
| Chickasaw | 99.9 /100 | #42 | Exceptional 92.3% |
| Spanish | 99.9 /100 | #43 | Exceptional 92.3% |
| Choctaw | 99.9 /100 | #44 | Exceptional 92.2% |
| Immigrants | Nonimmigrants | 99.9 /100 | #45 | Exceptional 92.2% |
| Immigrants | Fiji | 99.9 /100 | #46 | Exceptional 92.2% |
| Northern Europeans | 99.9 /100 | #47 | Exceptional 92.2% |
| Belgians | 99.9 /100 | #48 | Exceptional 92.1% |
| Afghans | 99.9 /100 | #49 | Exceptional 92.1% |
| Guamanians/Chamorros | 99.9 /100 | #50 | Exceptional 92.1% |
| Celtics | 99.9 /100 | #51 | Exceptional 92.1% |
| Koreans | 99.9 /100 | #52 | Exceptional 92.1% |
| Hawaiians | 99.9 /100 | #53 | Exceptional 92.0% |
| Slovenes | 99.9 /100 | #54 | Exceptional 92.0% |
| Immigrants | Afghanistan | 99.9 /100 | #55 | Exceptional 92.0% |
Demographics Similar to Macedonians by 1 or more Vehicles in Household
In terms of 1 or more vehicles in household, the demographic groups most similar to Macedonians are Immigrants from Switzerland (87.9%, a difference of 0.040%), Subsaharan African (87.9%, a difference of 0.070%), Nigerian (88.0%, a difference of 0.090%), Colombian (88.0%, a difference of 0.12%), and Liberian (88.0%, a difference of 0.12%).
| Demographics | Rating | Rank | 1 or more Vehicles in Household |
| Hondurans | 1.0 /100 | #253 | Tragic 88.1% |
| Haitians | 0.9 /100 | #254 | Tragic 88.1% |
| Immigrants | Latvia | 0.9 /100 | #255 | Tragic 88.1% |
| Colombians | 0.9 /100 | #256 | Tragic 88.0% |
| Liberians | 0.9 /100 | #257 | Tragic 88.0% |
| South American Indians | 0.9 /100 | #258 | Tragic 88.0% |
| Nigerians | 0.8 /100 | #259 | Tragic 88.0% |
| Macedonians | 0.6 /100 | #260 | Tragic 87.9% |
| Immigrants | Switzerland | 0.6 /100 | #261 | Tragic 87.9% |
| Sub-Saharan Africans | 0.5 /100 | #262 | Tragic 87.9% |
| Immigrants | Egypt | 0.5 /100 | #263 | Tragic 87.8% |
| Immigrants | Liberia | 0.4 /100 | #264 | Tragic 87.8% |
| Africans | 0.4 /100 | #265 | Tragic 87.8% |
| Israelis | 0.3 /100 | #266 | Tragic 87.7% |
| Immigrants | Colombia | 0.3 /100 | #267 | Tragic 87.6% |