Belgian vs Puget Sound Salish 1 or more Vehicles in Household
COMPARE
Belgian
Puget Sound Salish
1 or more Vehicles in Household
1 or more Vehicles in Household Comparison
Belgians
Puget Sound Salish
92.1%
1 OR MORE VEHICLES IN HOUSEHOLD
99.9/ 100
METRIC RATING
48th/ 347
METRIC RANK
90.5%
1 OR MORE VEHICLES IN HOUSEHOLD
91.5/ 100
METRIC RATING
124th/ 347
METRIC RANK
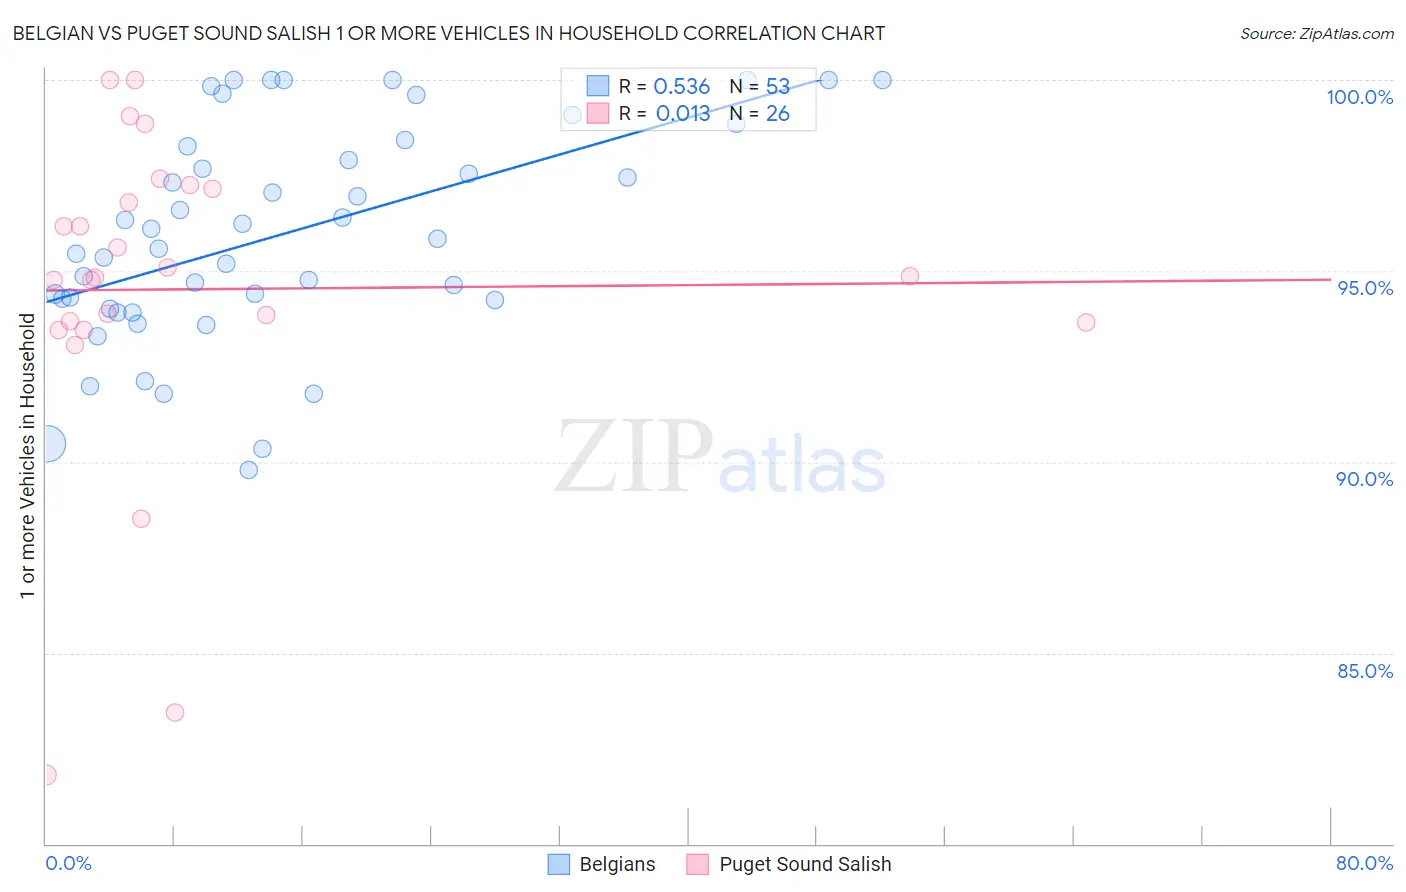
Belgian vs Puget Sound Salish 1 or more Vehicles in Household Correlation Chart
The statistical analysis conducted on geographies consisting of 355,873,468 people shows a substantial positive correlation between the proportion of Belgians and percentage of households with 1 or more vehicles available in the United States with a correlation coefficient (R) of 0.536 and weighted average of 92.1%. Similarly, the statistical analysis conducted on geographies consisting of 46,155,865 people shows no correlation between the proportion of Puget Sound Salish and percentage of households with 1 or more vehicles available in the United States with a correlation coefficient (R) of 0.013 and weighted average of 90.5%, a difference of 1.8%.
1 or more Vehicles in Household Correlation Summary
| Measurement | Belgian | Puget Sound Salish |
| Minimum | 89.8% | 81.8% |
| Maximum | 100.0% | 100.0% |
| Range | 10.2% | 18.2% |
| Mean | 96.0% | 94.5% |
| Median | 95.8% | 94.8% |
| Interquartile 25% (IQ1) | 94.1% | 93.7% |
| Interquartile 75% (IQ3) | 98.3% | 97.2% |
| Interquartile Range (IQR) | 4.2% | 3.5% |
| Standard Deviation (Sample) | 2.8% | 4.3% |
| Standard Deviation (Population) | 2.8% | 4.2% |
Similar Demographics by 1 or more Vehicles in Household
Demographics Similar to Belgians by 1 or more Vehicles in Household
In terms of 1 or more vehicles in household, the demographic groups most similar to Belgians are Afghan (92.1%, a difference of 0.010%), Guamanian/Chamorro (92.1%, a difference of 0.020%), Celtic (92.1%, a difference of 0.030%), Korean (92.1%, a difference of 0.060%), and Immigrants from Fiji (92.2%, a difference of 0.090%).
| Demographics | Rating | Rank | 1 or more Vehicles in Household |
| Immigrants | Taiwan | 99.9 /100 | #41 | Exceptional 92.3% |
| Chickasaw | 99.9 /100 | #42 | Exceptional 92.3% |
| Spanish | 99.9 /100 | #43 | Exceptional 92.3% |
| Choctaw | 99.9 /100 | #44 | Exceptional 92.2% |
| Immigrants | Nonimmigrants | 99.9 /100 | #45 | Exceptional 92.2% |
| Immigrants | Fiji | 99.9 /100 | #46 | Exceptional 92.2% |
| Northern Europeans | 99.9 /100 | #47 | Exceptional 92.2% |
| Belgians | 99.9 /100 | #48 | Exceptional 92.1% |
| Afghans | 99.9 /100 | #49 | Exceptional 92.1% |
| Guamanians/Chamorros | 99.9 /100 | #50 | Exceptional 92.1% |
| Celtics | 99.9 /100 | #51 | Exceptional 92.1% |
| Koreans | 99.9 /100 | #52 | Exceptional 92.1% |
| Hawaiians | 99.9 /100 | #53 | Exceptional 92.0% |
| Slovenes | 99.9 /100 | #54 | Exceptional 92.0% |
| Immigrants | Afghanistan | 99.9 /100 | #55 | Exceptional 92.0% |
Demographics Similar to Puget Sound Salish by 1 or more Vehicles in Household
In terms of 1 or more vehicles in household, the demographic groups most similar to Puget Sound Salish are Costa Rican (90.5%, a difference of 0.020%), Fijian (90.5%, a difference of 0.020%), Icelander (90.5%, a difference of 0.030%), Immigrants from Thailand (90.6%, a difference of 0.040%), and Immigrants from Korea (90.5%, a difference of 0.040%).
| Demographics | Rating | Rank | 1 or more Vehicles in Household |
| Greeks | 93.5 /100 | #117 | Exceptional 90.6% |
| Japanese | 93.4 /100 | #118 | Exceptional 90.6% |
| Blackfeet | 92.6 /100 | #119 | Exceptional 90.6% |
| Immigrants | Thailand | 92.3 /100 | #120 | Exceptional 90.6% |
| Icelanders | 92.1 /100 | #121 | Exceptional 90.5% |
| Costa Ricans | 92.0 /100 | #122 | Exceptional 90.5% |
| Fijians | 91.8 /100 | #123 | Exceptional 90.5% |
| Puget Sound Salish | 91.5 /100 | #124 | Exceptional 90.5% |
| Immigrants | Korea | 90.5 /100 | #125 | Exceptional 90.5% |
| Immigrants | Cameroon | 89.4 /100 | #126 | Excellent 90.4% |
| Immigrants | Azores | 89.1 /100 | #127 | Excellent 90.4% |
| Burmese | 89.0 /100 | #128 | Excellent 90.4% |
| Marshallese | 88.9 /100 | #129 | Excellent 90.4% |
| Nicaraguans | 88.8 /100 | #130 | Excellent 90.4% |
| Immigrants | Kenya | 88.5 /100 | #131 | Excellent 90.4% |