Belgian vs Maltese 1 or more Vehicles in Household
COMPARE
Belgian
Maltese
1 or more Vehicles in Household
1 or more Vehicles in Household Comparison
Belgians
Maltese
92.1%
1 OR MORE VEHICLES IN HOUSEHOLD
99.9/ 100
METRIC RATING
48th/ 347
METRIC RANK
91.0%
1 OR MORE VEHICLES IN HOUSEHOLD
97.7/ 100
METRIC RATING
107th/ 347
METRIC RANK
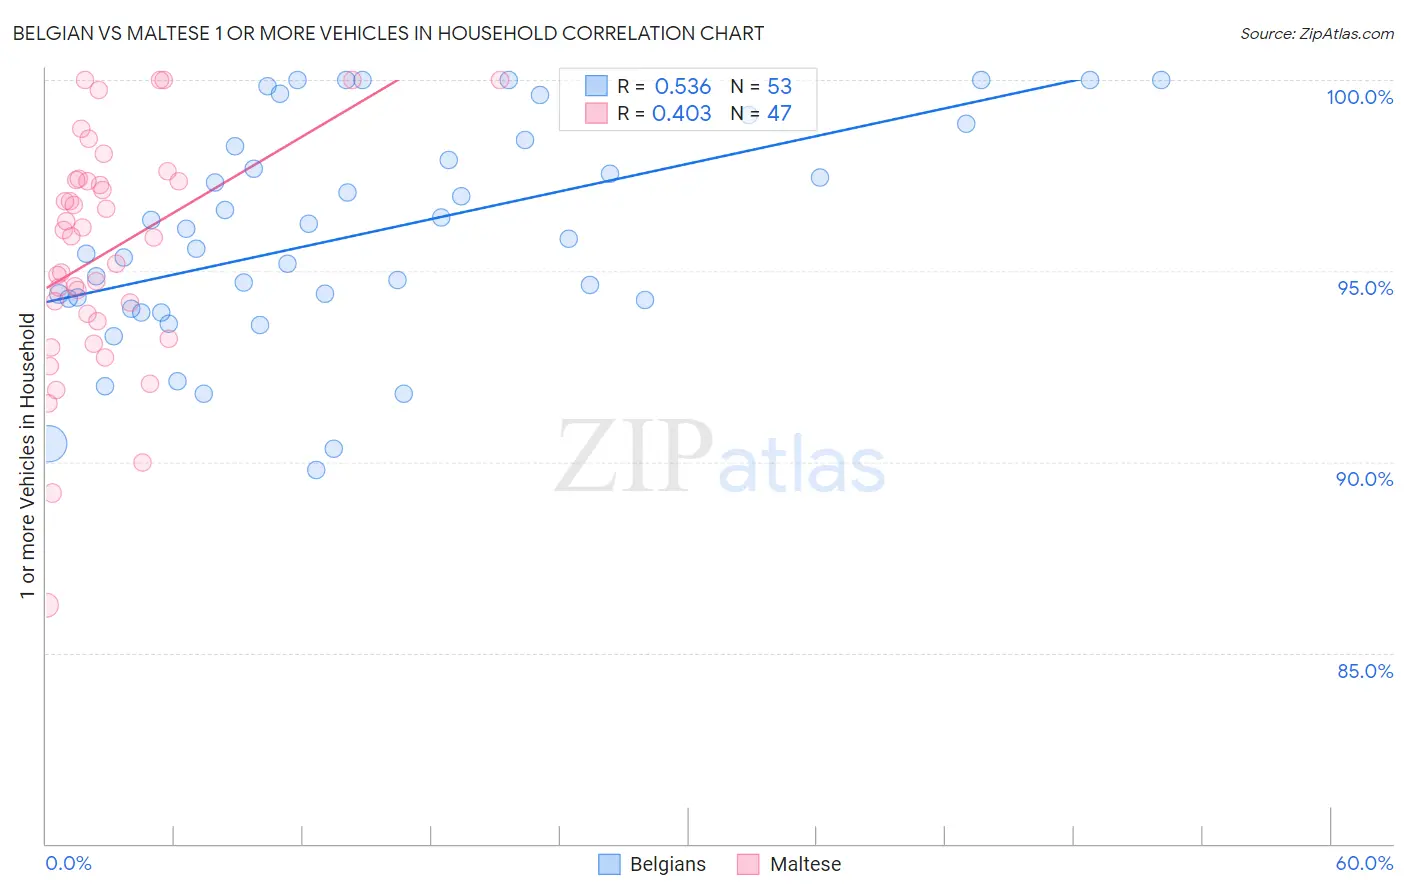
Belgian vs Maltese 1 or more Vehicles in Household Correlation Chart
The statistical analysis conducted on geographies consisting of 355,873,468 people shows a substantial positive correlation between the proportion of Belgians and percentage of households with 1 or more vehicles available in the United States with a correlation coefficient (R) of 0.536 and weighted average of 92.1%. Similarly, the statistical analysis conducted on geographies consisting of 126,283,538 people shows a moderate positive correlation between the proportion of Maltese and percentage of households with 1 or more vehicles available in the United States with a correlation coefficient (R) of 0.403 and weighted average of 91.0%, a difference of 1.2%.
1 or more Vehicles in Household Correlation Summary
| Measurement | Belgian | Maltese |
| Minimum | 89.8% | 86.3% |
| Maximum | 100.0% | 100.0% |
| Range | 10.2% | 13.7% |
| Mean | 96.0% | 95.5% |
| Median | 95.8% | 95.9% |
| Interquartile 25% (IQ1) | 94.1% | 93.7% |
| Interquartile 75% (IQ3) | 98.3% | 97.4% |
| Interquartile Range (IQR) | 4.2% | 3.7% |
| Standard Deviation (Sample) | 2.8% | 3.0% |
| Standard Deviation (Population) | 2.8% | 3.0% |
Similar Demographics by 1 or more Vehicles in Household
Demographics Similar to Belgians by 1 or more Vehicles in Household
In terms of 1 or more vehicles in household, the demographic groups most similar to Belgians are Afghan (92.1%, a difference of 0.010%), Guamanian/Chamorro (92.1%, a difference of 0.020%), Celtic (92.1%, a difference of 0.030%), Korean (92.1%, a difference of 0.060%), and Immigrants from Fiji (92.2%, a difference of 0.090%).
| Demographics | Rating | Rank | 1 or more Vehicles in Household |
| Immigrants | Taiwan | 99.9 /100 | #41 | Exceptional 92.3% |
| Chickasaw | 99.9 /100 | #42 | Exceptional 92.3% |
| Spanish | 99.9 /100 | #43 | Exceptional 92.3% |
| Choctaw | 99.9 /100 | #44 | Exceptional 92.2% |
| Immigrants | Nonimmigrants | 99.9 /100 | #45 | Exceptional 92.2% |
| Immigrants | Fiji | 99.9 /100 | #46 | Exceptional 92.2% |
| Northern Europeans | 99.9 /100 | #47 | Exceptional 92.2% |
| Belgians | 99.9 /100 | #48 | Exceptional 92.1% |
| Afghans | 99.9 /100 | #49 | Exceptional 92.1% |
| Guamanians/Chamorros | 99.9 /100 | #50 | Exceptional 92.1% |
| Celtics | 99.9 /100 | #51 | Exceptional 92.1% |
| Koreans | 99.9 /100 | #52 | Exceptional 92.1% |
| Hawaiians | 99.9 /100 | #53 | Exceptional 92.0% |
| Slovenes | 99.9 /100 | #54 | Exceptional 92.0% |
| Immigrants | Afghanistan | 99.9 /100 | #55 | Exceptional 92.0% |
Demographics Similar to Maltese by 1 or more Vehicles in Household
In terms of 1 or more vehicles in household, the demographic groups most similar to Maltese are Hispanic or Latino (91.0%, a difference of 0.0%), Delaware (91.0%, a difference of 0.010%), Zimbabwean (91.0%, a difference of 0.020%), Mexican American Indian (91.0%, a difference of 0.030%), and Laotian (91.0%, a difference of 0.060%).
| Demographics | Rating | Rank | 1 or more Vehicles in Household |
| Immigrants | Central America | 98.4 /100 | #100 | Exceptional 91.1% |
| Bulgarians | 98.4 /100 | #101 | Exceptional 91.1% |
| Seminole | 98.3 /100 | #102 | Exceptional 91.1% |
| Yugoslavians | 98.3 /100 | #103 | Exceptional 91.1% |
| Asians | 98.2 /100 | #104 | Exceptional 91.1% |
| Laotians | 98.0 /100 | #105 | Exceptional 91.0% |
| Zimbabweans | 97.7 /100 | #106 | Exceptional 91.0% |
| Maltese | 97.7 /100 | #107 | Exceptional 91.0% |
| Hispanics or Latinos | 97.6 /100 | #108 | Exceptional 91.0% |
| Delaware | 97.6 /100 | #109 | Exceptional 91.0% |
| Mexican American Indians | 97.4 /100 | #110 | Exceptional 91.0% |
| Navajo | 95.8 /100 | #111 | Exceptional 90.8% |
| Immigrants | Netherlands | 95.7 /100 | #112 | Exceptional 90.8% |
| Immigrants | Kuwait | 94.7 /100 | #113 | Exceptional 90.7% |
| Armenians | 94.5 /100 | #114 | Exceptional 90.7% |