Belgian vs Cuban 1 or more Vehicles in Household
COMPARE
Belgian
Cuban
1 or more Vehicles in Household
1 or more Vehicles in Household Comparison
Belgians
Cubans
92.1%
1 OR MORE VEHICLES IN HOUSEHOLD
99.9/ 100
METRIC RATING
48th/ 347
METRIC RANK
91.5%
1 OR MORE VEHICLES IN HOUSEHOLD
99.5/ 100
METRIC RATING
76th/ 347
METRIC RANK
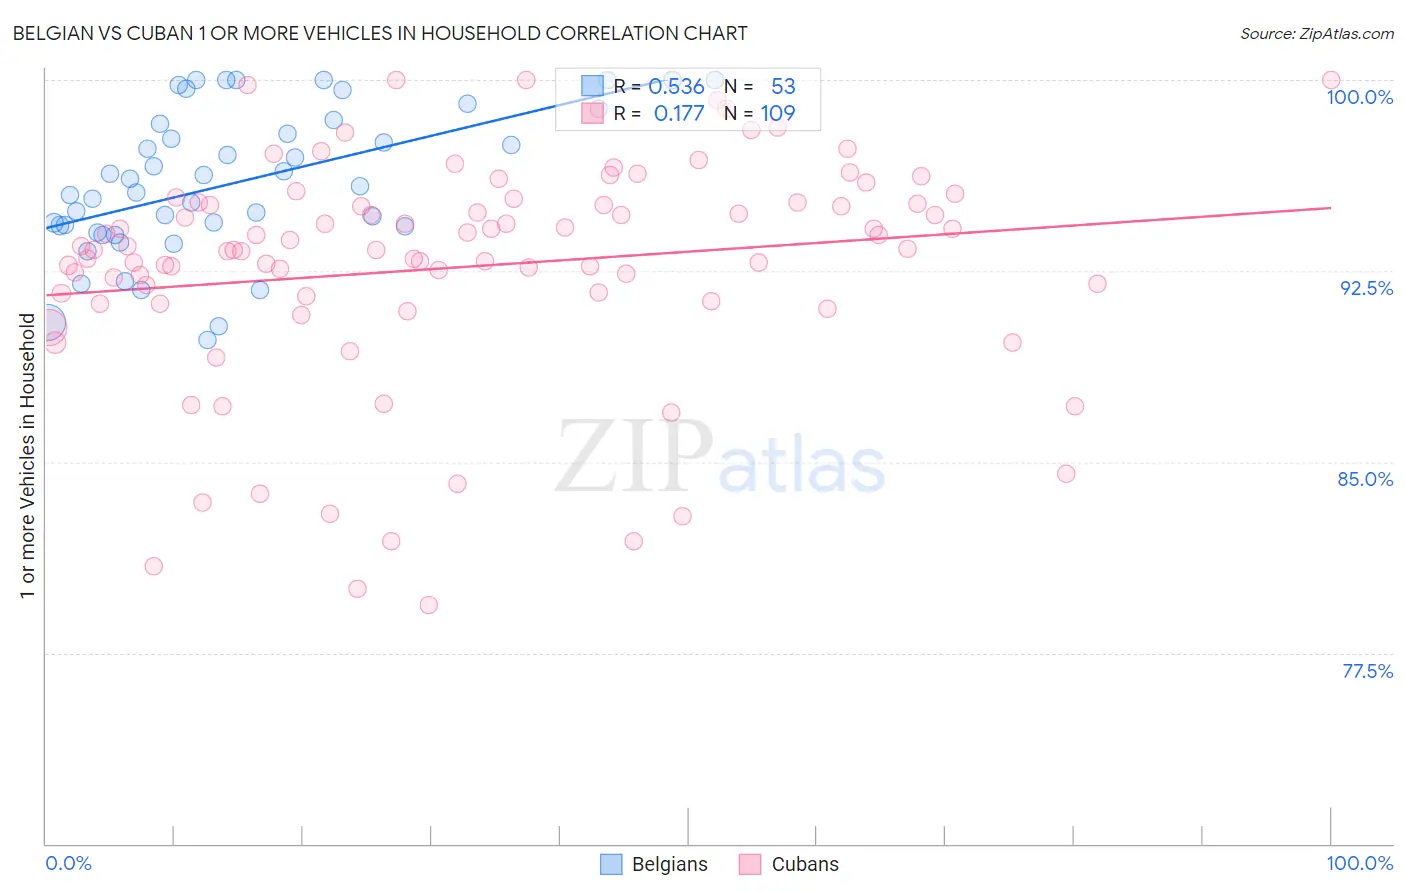
Belgian vs Cuban 1 or more Vehicles in Household Correlation Chart
The statistical analysis conducted on geographies consisting of 355,873,468 people shows a substantial positive correlation between the proportion of Belgians and percentage of households with 1 or more vehicles available in the United States with a correlation coefficient (R) of 0.536 and weighted average of 92.1%. Similarly, the statistical analysis conducted on geographies consisting of 448,885,353 people shows a poor positive correlation between the proportion of Cubans and percentage of households with 1 or more vehicles available in the United States with a correlation coefficient (R) of 0.177 and weighted average of 91.5%, a difference of 0.64%.
1 or more Vehicles in Household Correlation Summary
| Measurement | Belgian | Cuban |
| Minimum | 89.8% | 79.4% |
| Maximum | 100.0% | 100.0% |
| Range | 10.2% | 20.6% |
| Mean | 96.0% | 92.7% |
| Median | 95.8% | 93.3% |
| Interquartile 25% (IQ1) | 94.1% | 91.4% |
| Interquartile 75% (IQ3) | 98.3% | 95.2% |
| Interquartile Range (IQR) | 4.2% | 3.8% |
| Standard Deviation (Sample) | 2.8% | 4.4% |
| Standard Deviation (Population) | 2.8% | 4.4% |
Similar Demographics by 1 or more Vehicles in Household
Demographics Similar to Belgians by 1 or more Vehicles in Household
In terms of 1 or more vehicles in household, the demographic groups most similar to Belgians are Afghan (92.1%, a difference of 0.010%), Guamanian/Chamorro (92.1%, a difference of 0.020%), Celtic (92.1%, a difference of 0.030%), Korean (92.1%, a difference of 0.060%), and Immigrants from Fiji (92.2%, a difference of 0.090%).
| Demographics | Rating | Rank | 1 or more Vehicles in Household |
| Immigrants | Taiwan | 99.9 /100 | #41 | Exceptional 92.3% |
| Chickasaw | 99.9 /100 | #42 | Exceptional 92.3% |
| Spanish | 99.9 /100 | #43 | Exceptional 92.3% |
| Choctaw | 99.9 /100 | #44 | Exceptional 92.2% |
| Immigrants | Nonimmigrants | 99.9 /100 | #45 | Exceptional 92.2% |
| Immigrants | Fiji | 99.9 /100 | #46 | Exceptional 92.2% |
| Northern Europeans | 99.9 /100 | #47 | Exceptional 92.2% |
| Belgians | 99.9 /100 | #48 | Exceptional 92.1% |
| Afghans | 99.9 /100 | #49 | Exceptional 92.1% |
| Guamanians/Chamorros | 99.9 /100 | #50 | Exceptional 92.1% |
| Celtics | 99.9 /100 | #51 | Exceptional 92.1% |
| Koreans | 99.9 /100 | #52 | Exceptional 92.1% |
| Hawaiians | 99.9 /100 | #53 | Exceptional 92.0% |
| Slovenes | 99.9 /100 | #54 | Exceptional 92.0% |
| Immigrants | Afghanistan | 99.9 /100 | #55 | Exceptional 92.0% |
Demographics Similar to Cubans by 1 or more Vehicles in Household
In terms of 1 or more vehicles in household, the demographic groups most similar to Cubans are Portuguese (91.6%, a difference of 0.020%), Immigrants from Philippines (91.5%, a difference of 0.040%), Iranian (91.5%, a difference of 0.040%), Immigrants from South Central Asia (91.5%, a difference of 0.060%), and Bolivian (91.5%, a difference of 0.070%).
| Demographics | Rating | Rank | 1 or more Vehicles in Household |
| Palestinians | 99.7 /100 | #69 | Exceptional 91.7% |
| Lithuanians | 99.7 /100 | #70 | Exceptional 91.7% |
| Poles | 99.7 /100 | #71 | Exceptional 91.7% |
| Cajuns | 99.7 /100 | #72 | Exceptional 91.7% |
| Immigrants | Iran | 99.7 /100 | #73 | Exceptional 91.7% |
| Immigrants | Lebanon | 99.6 /100 | #74 | Exceptional 91.6% |
| Portuguese | 99.5 /100 | #75 | Exceptional 91.6% |
| Cubans | 99.5 /100 | #76 | Exceptional 91.5% |
| Immigrants | Philippines | 99.4 /100 | #77 | Exceptional 91.5% |
| Iranians | 99.4 /100 | #78 | Exceptional 91.5% |
| Immigrants | South Central Asia | 99.4 /100 | #79 | Exceptional 91.5% |
| Bolivians | 99.4 /100 | #80 | Exceptional 91.5% |
| Immigrants | South Eastern Asia | 99.3 /100 | #81 | Exceptional 91.4% |
| Lebanese | 99.3 /100 | #82 | Exceptional 91.4% |
| Immigrants | England | 99.3 /100 | #83 | Exceptional 91.4% |