Barbadian vs Immigrants from Uganda 3 or more Vehicles in Household
COMPARE
Barbadian
Immigrants from Uganda
3 or more Vehicles in Household
3 or more Vehicles in Household Comparison
Barbadians
Immigrants from Uganda
12.6%
3 OR MORE VEHICLES IN HOUSEHOLD
0.0/ 100
METRIC RATING
336th/ 347
METRIC RANK
18.4%
3 OR MORE VEHICLES IN HOUSEHOLD
4.6/ 100
METRIC RATING
232nd/ 347
METRIC RANK
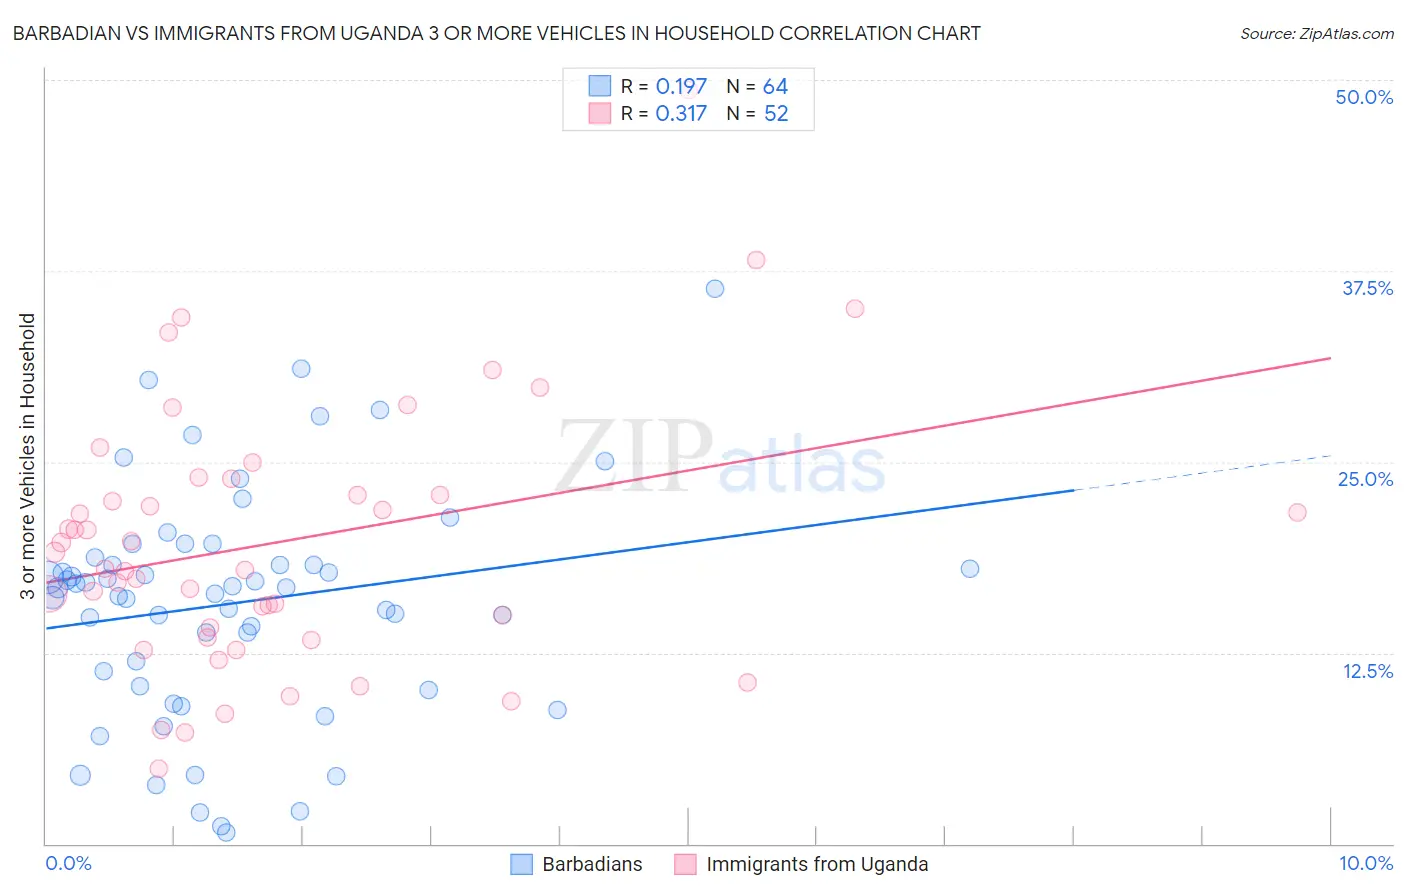
Barbadian vs Immigrants from Uganda 3 or more Vehicles in Household Correlation Chart
The statistical analysis conducted on geographies consisting of 141,251,971 people shows a poor positive correlation between the proportion of Barbadians and percentage of households with 3 or more vehicles available in the United States with a correlation coefficient (R) of 0.197 and weighted average of 12.6%. Similarly, the statistical analysis conducted on geographies consisting of 125,972,253 people shows a mild positive correlation between the proportion of Immigrants from Uganda and percentage of households with 3 or more vehicles available in the United States with a correlation coefficient (R) of 0.317 and weighted average of 18.4%, a difference of 46.2%.
3 or more Vehicles in Household Correlation Summary
| Measurement | Barbadian | Immigrants from Uganda |
| Minimum | 0.77% | 4.9% |
| Maximum | 36.4% | 49.4% |
| Range | 35.6% | 44.5% |
| Mean | 15.8% | 19.8% |
| Median | 16.8% | 18.5% |
| Interquartile 25% (IQ1) | 10.8% | 13.8% |
| Interquartile 75% (IQ3) | 18.5% | 23.3% |
| Interquartile Range (IQR) | 7.7% | 9.5% |
| Standard Deviation (Sample) | 7.5% | 8.7% |
| Standard Deviation (Population) | 7.4% | 8.6% |
Similar Demographics by 3 or more Vehicles in Household
Demographics Similar to Barbadians by 3 or more Vehicles in Household
In terms of 3 or more vehicles in household, the demographic groups most similar to Barbadians are Immigrants from Bangladesh (12.5%, a difference of 0.44%), Vietnamese (12.5%, a difference of 0.98%), Immigrants from Uzbekistan (12.0%, a difference of 4.9%), Immigrants from Trinidad and Tobago (13.3%, a difference of 6.1%), and Immigrants from Ecuador (13.4%, a difference of 6.6%).
| Demographics | Rating | Rank | 3 or more Vehicles in Household |
| Immigrants | Senegal | 0.0 /100 | #329 | Tragic 13.8% |
| West Indians | 0.0 /100 | #330 | Tragic 13.7% |
| Immigrants | Dominica | 0.0 /100 | #331 | Tragic 13.7% |
| Trinidadians and Tobagonians | 0.0 /100 | #332 | Tragic 13.6% |
| Immigrants | Cabo Verde | 0.0 /100 | #333 | Tragic 13.6% |
| Immigrants | Ecuador | 0.0 /100 | #334 | Tragic 13.4% |
| Immigrants | Trinidad and Tobago | 0.0 /100 | #335 | Tragic 13.3% |
| Barbadians | 0.0 /100 | #336 | Tragic 12.6% |
| Immigrants | Bangladesh | 0.0 /100 | #337 | Tragic 12.5% |
| Vietnamese | 0.0 /100 | #338 | Tragic 12.5% |
| Immigrants | Uzbekistan | 0.0 /100 | #339 | Tragic 12.0% |
| Immigrants | Barbados | 0.0 /100 | #340 | Tragic 11.7% |
| Guyanese | 0.0 /100 | #341 | Tragic 11.5% |
| British West Indians | 0.0 /100 | #342 | Tragic 11.4% |
| Immigrants | Guyana | 0.0 /100 | #343 | Tragic 11.2% |
Demographics Similar to Immigrants from Uganda by 3 or more Vehicles in Household
In terms of 3 or more vehicles in household, the demographic groups most similar to Immigrants from Uganda are Honduran (18.4%, a difference of 0.020%), Immigrants from Belgium (18.4%, a difference of 0.060%), Immigrants from North Macedonia (18.4%, a difference of 0.080%), Immigrants from Western Asia (18.4%, a difference of 0.090%), and Immigrants from Switzerland (18.4%, a difference of 0.14%).
| Demographics | Rating | Rank | 3 or more Vehicles in Household |
| Immigrants | Lithuania | 5.6 /100 | #225 | Tragic 18.5% |
| Immigrants | Hungary | 5.5 /100 | #226 | Tragic 18.5% |
| Immigrants | Singapore | 5.4 /100 | #227 | Tragic 18.4% |
| Turks | 5.4 /100 | #228 | Tragic 18.4% |
| Immigrants | Switzerland | 5.0 /100 | #229 | Tragic 18.4% |
| Immigrants | Western Asia | 4.8 /100 | #230 | Tragic 18.4% |
| Immigrants | Belgium | 4.8 /100 | #231 | Tragic 18.4% |
| Immigrants | Uganda | 4.6 /100 | #232 | Tragic 18.4% |
| Hondurans | 4.6 /100 | #233 | Tragic 18.4% |
| Immigrants | North Macedonia | 4.4 /100 | #234 | Tragic 18.4% |
| Sierra Leoneans | 3.9 /100 | #235 | Tragic 18.3% |
| Immigrants | Malaysia | 3.6 /100 | #236 | Tragic 18.3% |
| Indonesians | 3.5 /100 | #237 | Tragic 18.3% |
| Immigrants | Honduras | 3.1 /100 | #238 | Tragic 18.2% |
| Immigrants | Middle Africa | 3.1 /100 | #239 | Tragic 18.2% |