Barbadian vs Immigrants from Uganda Male Disability
COMPARE
Barbadian
Immigrants from Uganda
Male Disability
Male Disability Comparison
Barbadians
Immigrants from Uganda
11.2%
MALE DISABILITY
53.4/ 100
METRIC RATING
169th/ 347
METRIC RANK
10.8%
MALE DISABILITY
94.0/ 100
METRIC RATING
109th/ 347
METRIC RANK
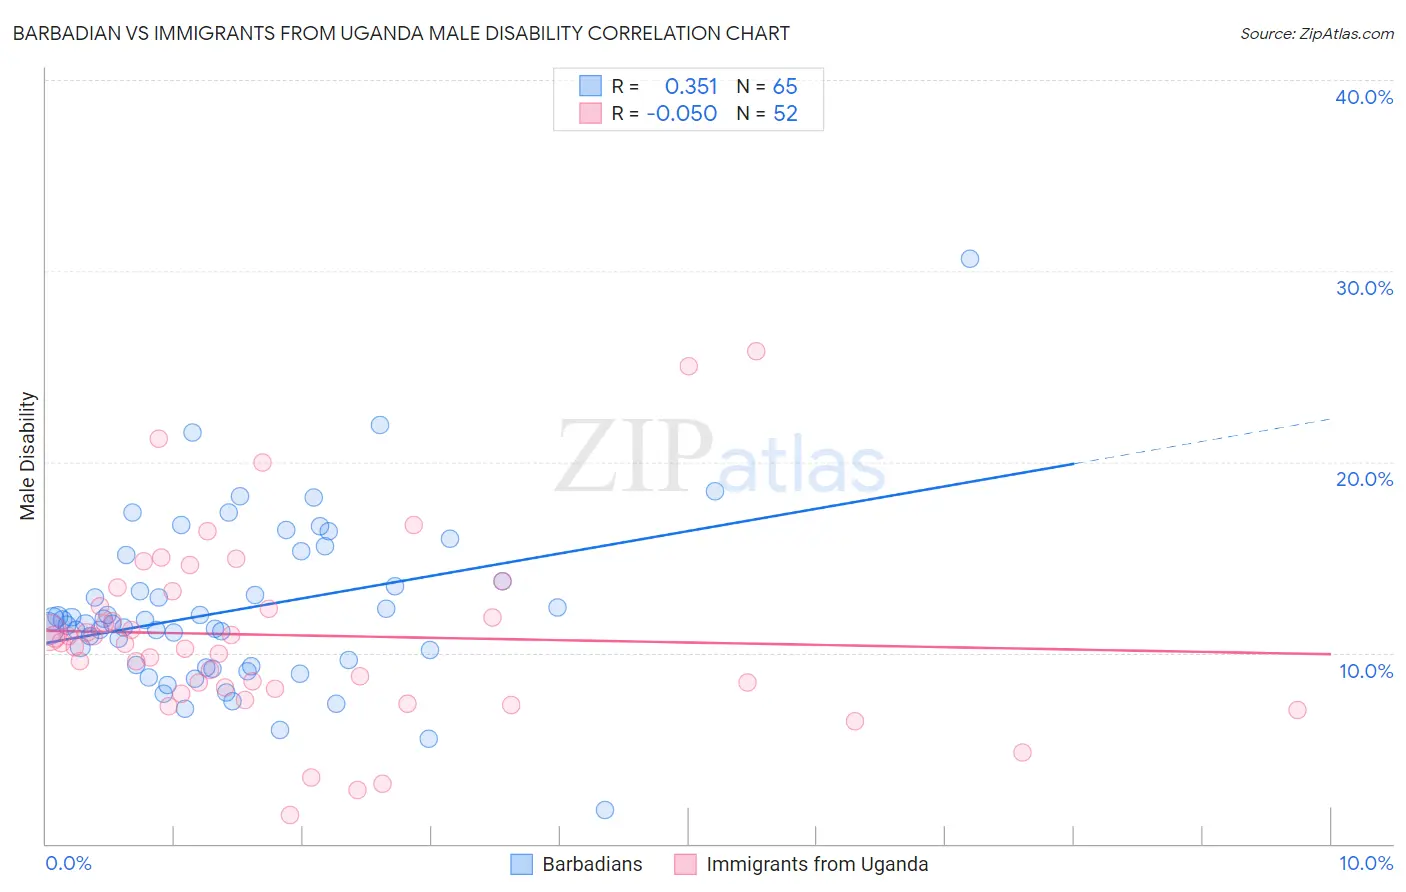
Barbadian vs Immigrants from Uganda Male Disability Correlation Chart
The statistical analysis conducted on geographies consisting of 141,288,845 people shows a mild positive correlation between the proportion of Barbadians and percentage of males with a disability in the United States with a correlation coefficient (R) of 0.351 and weighted average of 11.2%. Similarly, the statistical analysis conducted on geographies consisting of 125,978,860 people shows a slight negative correlation between the proportion of Immigrants from Uganda and percentage of males with a disability in the United States with a correlation coefficient (R) of -0.050 and weighted average of 10.8%, a difference of 3.8%.
Male Disability Correlation Summary
| Measurement | Barbadian | Immigrants from Uganda |
| Minimum | 1.8% | 1.5% |
| Maximum | 30.6% | 25.8% |
| Range | 28.8% | 24.3% |
| Mean | 12.3% | 10.9% |
| Median | 11.6% | 10.5% |
| Interquartile 25% (IQ1) | 9.3% | 8.2% |
| Interquartile 75% (IQ3) | 14.4% | 12.8% |
| Interquartile Range (IQR) | 5.1% | 4.7% |
| Standard Deviation (Sample) | 4.4% | 4.9% |
| Standard Deviation (Population) | 4.4% | 4.8% |
Similar Demographics by Male Disability
Demographics Similar to Barbadians by Male Disability
In terms of male disability, the demographic groups most similar to Barbadians are Immigrants from Latin America (11.2%, a difference of 0.030%), New Zealander (11.2%, a difference of 0.030%), Haitian (11.2%, a difference of 0.050%), Immigrants from Southern Europe (11.2%, a difference of 0.060%), and Romanian (11.2%, a difference of 0.15%).
| Demographics | Rating | Rank | Male Disability |
| Immigrants | Haiti | 65.3 /100 | #162 | Good 11.1% |
| Immigrants | Kenya | 63.8 /100 | #163 | Good 11.1% |
| British West Indians | 62.8 /100 | #164 | Good 11.1% |
| Luxembourgers | 61.9 /100 | #165 | Good 11.1% |
| Immigrants | Hungary | 61.2 /100 | #166 | Good 11.1% |
| Immigrants | Southern Europe | 54.4 /100 | #167 | Average 11.2% |
| Immigrants | Latin America | 54.0 /100 | #168 | Average 11.2% |
| Barbadians | 53.4 /100 | #169 | Average 11.2% |
| New Zealanders | 52.9 /100 | #170 | Average 11.2% |
| Haitians | 52.5 /100 | #171 | Average 11.2% |
| Romanians | 50.7 /100 | #172 | Average 11.2% |
| Immigrants | Burma/Myanmar | 50.4 /100 | #173 | Average 11.2% |
| Maltese | 50.0 /100 | #174 | Average 11.2% |
| Immigrants | Honduras | 48.7 /100 | #175 | Average 11.2% |
| Syrians | 46.6 /100 | #176 | Average 11.2% |
Demographics Similar to Immigrants from Uganda by Male Disability
In terms of male disability, the demographic groups most similar to Immigrants from Uganda are Immigrants (10.8%, a difference of 0.030%), Immigrants from Belgium (10.8%, a difference of 0.050%), Immigrants from Uruguay (10.8%, a difference of 0.060%), Immigrants from Eastern Africa (10.8%, a difference of 0.070%), and Ghanaian (10.8%, a difference of 0.16%).
| Demographics | Rating | Rank | Male Disability |
| Immigrants | Eastern Europe | 95.3 /100 | #102 | Exceptional 10.7% |
| Uruguayans | 95.3 /100 | #103 | Exceptional 10.7% |
| Immigrants | Nigeria | 95.1 /100 | #104 | Exceptional 10.8% |
| Immigrants | Brazil | 95.0 /100 | #105 | Exceptional 10.8% |
| Immigrants | Syria | 94.9 /100 | #106 | Exceptional 10.8% |
| Immigrants | Eastern Africa | 94.3 /100 | #107 | Exceptional 10.8% |
| Immigrants | Belgium | 94.2 /100 | #108 | Exceptional 10.8% |
| Immigrants | Uganda | 94.0 /100 | #109 | Exceptional 10.8% |
| Immigrants | Immigrants | 93.9 /100 | #110 | Exceptional 10.8% |
| Immigrants | Uruguay | 93.8 /100 | #111 | Exceptional 10.8% |
| Ghanaians | 93.4 /100 | #112 | Exceptional 10.8% |
| Immigrants | Zimbabwe | 93.0 /100 | #113 | Exceptional 10.8% |
| Central Americans | 92.7 /100 | #114 | Exceptional 10.8% |
| Immigrants | Barbados | 92.2 /100 | #115 | Exceptional 10.8% |
| Immigrants | South Africa | 91.8 /100 | #116 | Exceptional 10.8% |