Apache vs Immigrants from Uganda 3 or more Vehicles in Household
COMPARE
Apache
Immigrants from Uganda
3 or more Vehicles in Household
3 or more Vehicles in Household Comparison
Apache
Immigrants from Uganda
21.2%
3 OR MORE VEHICLES IN HOUSEHOLD
98.9/ 100
METRIC RATING
92nd/ 347
METRIC RANK
18.4%
3 OR MORE VEHICLES IN HOUSEHOLD
4.6/ 100
METRIC RATING
232nd/ 347
METRIC RANK
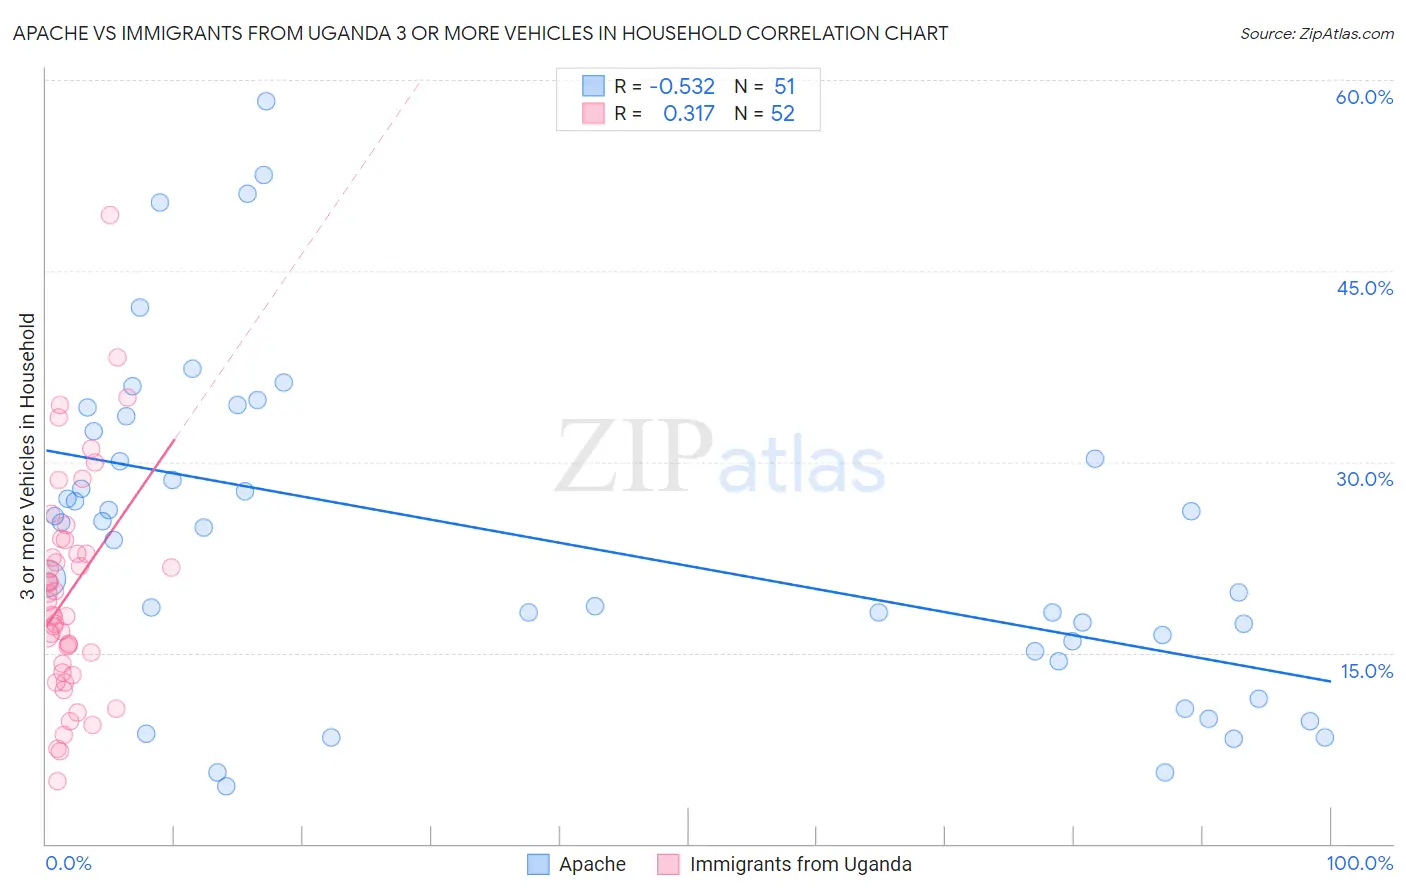
Apache vs Immigrants from Uganda 3 or more Vehicles in Household Correlation Chart
The statistical analysis conducted on geographies consisting of 231,026,513 people shows a substantial negative correlation between the proportion of Apache and percentage of households with 3 or more vehicles available in the United States with a correlation coefficient (R) of -0.532 and weighted average of 21.2%. Similarly, the statistical analysis conducted on geographies consisting of 125,972,253 people shows a mild positive correlation between the proportion of Immigrants from Uganda and percentage of households with 3 or more vehicles available in the United States with a correlation coefficient (R) of 0.317 and weighted average of 18.4%, a difference of 15.1%.
3 or more Vehicles in Household Correlation Summary
| Measurement | Apache | Immigrants from Uganda |
| Minimum | 4.5% | 4.9% |
| Maximum | 58.3% | 49.4% |
| Range | 53.9% | 44.5% |
| Mean | 24.1% | 19.8% |
| Median | 24.8% | 18.5% |
| Interquartile 25% (IQ1) | 15.1% | 13.8% |
| Interquartile 75% (IQ3) | 32.4% | 23.3% |
| Interquartile Range (IQR) | 17.3% | 9.5% |
| Standard Deviation (Sample) | 12.8% | 8.7% |
| Standard Deviation (Population) | 12.7% | 8.6% |
Similar Demographics by 3 or more Vehicles in Household
Demographics Similar to Apache by 3 or more Vehicles in Household
In terms of 3 or more vehicles in household, the demographic groups most similar to Apache are Belgian (21.2%, a difference of 0.080%), Immigrants from Indonesia (21.1%, a difference of 0.20%), Immigrants from Afghanistan (21.2%, a difference of 0.41%), Immigrants from Cambodia (21.1%, a difference of 0.43%), and Pakistani (21.0%, a difference of 0.57%).
| Demographics | Rating | Rank | 3 or more Vehicles in Household |
| Laotians | 99.6 /100 | #85 | Exceptional 21.5% |
| Delaware | 99.6 /100 | #86 | Exceptional 21.5% |
| Immigrants | Azores | 99.5 /100 | #87 | Exceptional 21.5% |
| French | 99.4 /100 | #88 | Exceptional 21.4% |
| Marshallese | 99.2 /100 | #89 | Exceptional 21.3% |
| Immigrants | Afghanistan | 99.1 /100 | #90 | Exceptional 21.2% |
| Belgians | 98.9 /100 | #91 | Exceptional 21.2% |
| Apache | 98.9 /100 | #92 | Exceptional 21.2% |
| Immigrants | Indonesia | 98.8 /100 | #93 | Exceptional 21.1% |
| Immigrants | Cambodia | 98.6 /100 | #94 | Exceptional 21.1% |
| Pakistanis | 98.5 /100 | #95 | Exceptional 21.0% |
| Cree | 98.4 /100 | #96 | Exceptional 21.0% |
| Canadians | 98.3 /100 | #97 | Exceptional 21.0% |
| Hmong | 98.2 /100 | #98 | Exceptional 21.0% |
| Alaska Natives | 98.2 /100 | #99 | Exceptional 21.0% |
Demographics Similar to Immigrants from Uganda by 3 or more Vehicles in Household
In terms of 3 or more vehicles in household, the demographic groups most similar to Immigrants from Uganda are Honduran (18.4%, a difference of 0.020%), Immigrants from Belgium (18.4%, a difference of 0.060%), Immigrants from North Macedonia (18.4%, a difference of 0.080%), Immigrants from Western Asia (18.4%, a difference of 0.090%), and Immigrants from Switzerland (18.4%, a difference of 0.14%).
| Demographics | Rating | Rank | 3 or more Vehicles in Household |
| Immigrants | Lithuania | 5.6 /100 | #225 | Tragic 18.5% |
| Immigrants | Hungary | 5.5 /100 | #226 | Tragic 18.5% |
| Immigrants | Singapore | 5.4 /100 | #227 | Tragic 18.4% |
| Turks | 5.4 /100 | #228 | Tragic 18.4% |
| Immigrants | Switzerland | 5.0 /100 | #229 | Tragic 18.4% |
| Immigrants | Western Asia | 4.8 /100 | #230 | Tragic 18.4% |
| Immigrants | Belgium | 4.8 /100 | #231 | Tragic 18.4% |
| Immigrants | Uganda | 4.6 /100 | #232 | Tragic 18.4% |
| Hondurans | 4.6 /100 | #233 | Tragic 18.4% |
| Immigrants | North Macedonia | 4.4 /100 | #234 | Tragic 18.4% |
| Sierra Leoneans | 3.9 /100 | #235 | Tragic 18.3% |
| Immigrants | Malaysia | 3.6 /100 | #236 | Tragic 18.3% |
| Indonesians | 3.5 /100 | #237 | Tragic 18.3% |
| Immigrants | Honduras | 3.1 /100 | #238 | Tragic 18.2% |
| Immigrants | Middle Africa | 3.1 /100 | #239 | Tragic 18.2% |