Armenian vs Immigrants from France Male Unemployment
COMPARE
Armenian
Immigrants from France
Male Unemployment
Male Unemployment Comparison
Armenians
Immigrants from France
6.0%
MALE UNEMPLOYMENT
0.0/ 100
METRIC RATING
273rd/ 347
METRIC RANK
5.1%
MALE UNEMPLOYMENT
92.7/ 100
METRIC RATING
102nd/ 347
METRIC RANK
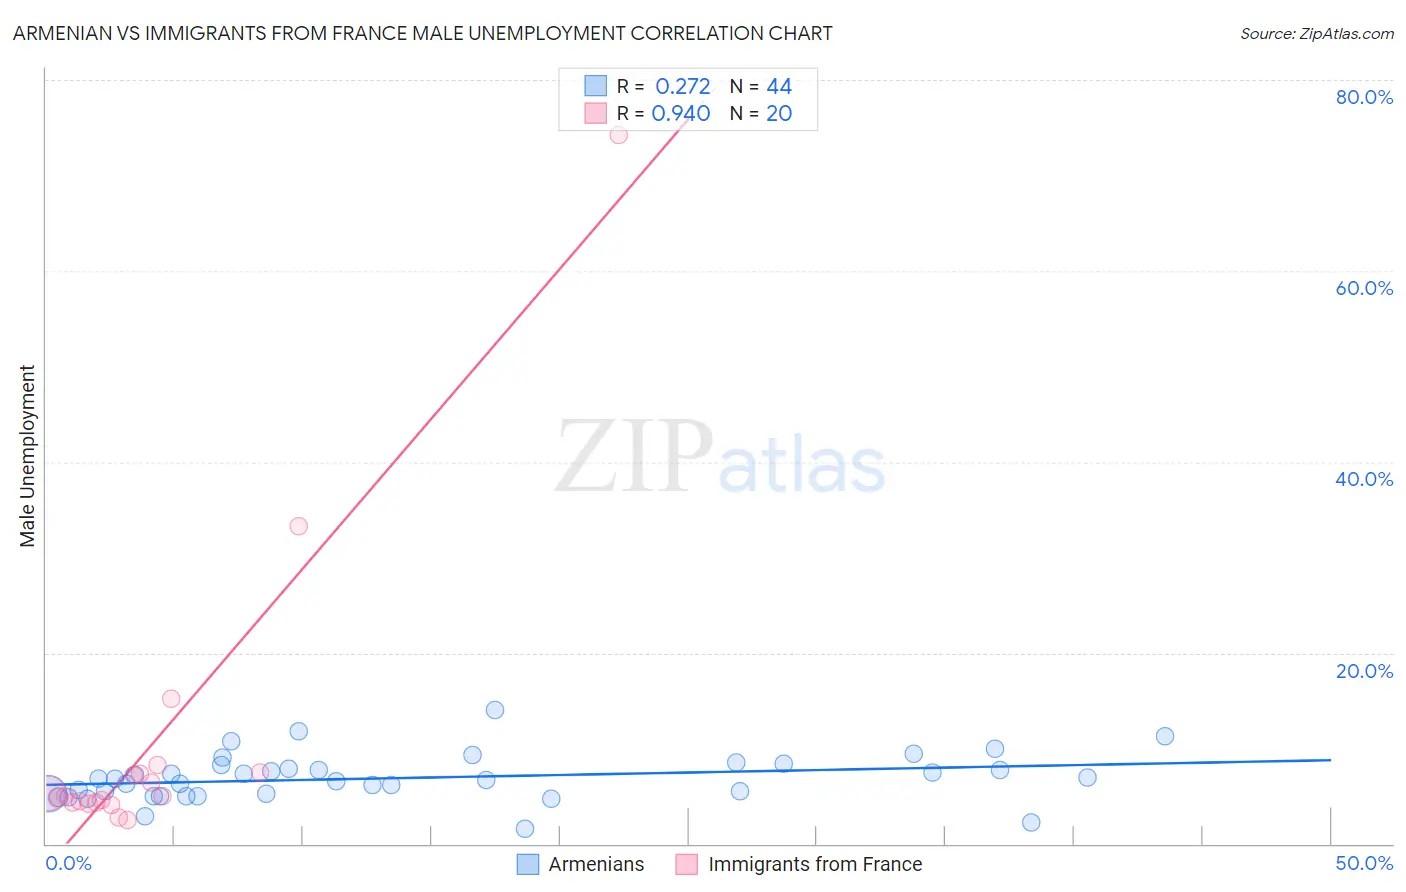
Armenian vs Immigrants from France Male Unemployment Correlation Chart
The statistical analysis conducted on geographies consisting of 310,068,401 people shows a weak positive correlation between the proportion of Armenians and unemployment rate among males in the United States with a correlation coefficient (R) of 0.272 and weighted average of 6.0%. Similarly, the statistical analysis conducted on geographies consisting of 287,192,978 people shows a near-perfect positive correlation between the proportion of Immigrants from France and unemployment rate among males in the United States with a correlation coefficient (R) of 0.940 and weighted average of 5.1%, a difference of 17.8%.
Male Unemployment Correlation Summary
| Measurement | Armenian | Immigrants from France |
| Minimum | 1.6% | 2.5% |
| Maximum | 14.0% | 74.2% |
| Range | 12.4% | 71.7% |
| Mean | 6.9% | 10.5% |
| Median | 6.8% | 5.0% |
| Interquartile 25% (IQ1) | 5.1% | 4.3% |
| Interquartile 75% (IQ3) | 8.0% | 7.4% |
| Interquartile Range (IQR) | 2.9% | 3.1% |
| Standard Deviation (Sample) | 2.4% | 16.4% |
| Standard Deviation (Population) | 2.4% | 16.0% |
Similar Demographics by Male Unemployment
Demographics Similar to Armenians by Male Unemployment
In terms of male unemployment, the demographic groups most similar to Armenians are Immigrants from Uzbekistan (6.0%, a difference of 0.010%), Immigrants from Sierra Leone (6.0%, a difference of 0.17%), Blackfeet (6.0%, a difference of 0.24%), Menominee (6.0%, a difference of 0.33%), and Tlingit-Haida (6.0%, a difference of 0.43%).
| Demographics | Rating | Rank | Male Unemployment |
| Bahamians | 0.0 /100 | #266 | Tragic 5.9% |
| Nigerians | 0.0 /100 | #267 | Tragic 5.9% |
| Bermudans | 0.0 /100 | #268 | Tragic 5.9% |
| Immigrants | Nigeria | 0.0 /100 | #269 | Tragic 6.0% |
| Sub-Saharan Africans | 0.0 /100 | #270 | Tragic 6.0% |
| Blackfeet | 0.0 /100 | #271 | Tragic 6.0% |
| Immigrants | Uzbekistan | 0.0 /100 | #272 | Tragic 6.0% |
| Armenians | 0.0 /100 | #273 | Tragic 6.0% |
| Immigrants | Sierra Leone | 0.0 /100 | #274 | Tragic 6.0% |
| Menominee | 0.0 /100 | #275 | Tragic 6.0% |
| Tlingit-Haida | 0.0 /100 | #276 | Tragic 6.0% |
| Immigrants | Liberia | 0.0 /100 | #277 | Tragic 6.1% |
| Immigrants | Fiji | 0.0 /100 | #278 | Tragic 6.1% |
| Ghanaians | 0.0 /100 | #279 | Tragic 6.1% |
| Immigrants | Ghana | 0.0 /100 | #280 | Tragic 6.2% |
Demographics Similar to Immigrants from France by Male Unemployment
In terms of male unemployment, the demographic groups most similar to Immigrants from France are German Russian (5.1%, a difference of 0.020%), Russian (5.1%, a difference of 0.060%), Uruguayan (5.1%, a difference of 0.070%), Immigrants from Kuwait (5.1%, a difference of 0.14%), and Immigrants from Jordan (5.1%, a difference of 0.16%).
| Demographics | Rating | Rank | Male Unemployment |
| Italians | 93.8 /100 | #95 | Exceptional 5.1% |
| Asians | 93.7 /100 | #96 | Exceptional 5.1% |
| Immigrants | Spain | 93.4 /100 | #97 | Exceptional 5.1% |
| Immigrants | Kuwait | 93.3 /100 | #98 | Exceptional 5.1% |
| Uruguayans | 93.0 /100 | #99 | Exceptional 5.1% |
| Russians | 92.9 /100 | #100 | Exceptional 5.1% |
| German Russians | 92.7 /100 | #101 | Exceptional 5.1% |
| Immigrants | France | 92.7 /100 | #102 | Exceptional 5.1% |
| Immigrants | Jordan | 91.9 /100 | #103 | Exceptional 5.1% |
| Immigrants | Chile | 91.8 /100 | #104 | Exceptional 5.1% |
| Immigrants | Czechoslovakia | 91.7 /100 | #105 | Exceptional 5.1% |
| Immigrants | Ethiopia | 91.5 /100 | #106 | Exceptional 5.1% |
| Ethiopians | 91.3 /100 | #107 | Exceptional 5.1% |
| Immigrants | Nicaragua | 91.2 /100 | #108 | Exceptional 5.1% |
| Immigrants | Pakistan | 90.9 /100 | #109 | Exceptional 5.1% |