Ethiopian vs Soviet Union 3 or more Vehicles in Household
COMPARE
Ethiopian
Soviet Union
3 or more Vehicles in Household
3 or more Vehicles in Household Comparison
Ethiopians
Soviet Union
17.9%
3 OR MORE VEHICLES IN HOUSEHOLD
1.2/ 100
METRIC RATING
254th/ 347
METRIC RANK
14.2%
3 OR MORE VEHICLES IN HOUSEHOLD
0.0/ 100
METRIC RATING
326th/ 347
METRIC RANK
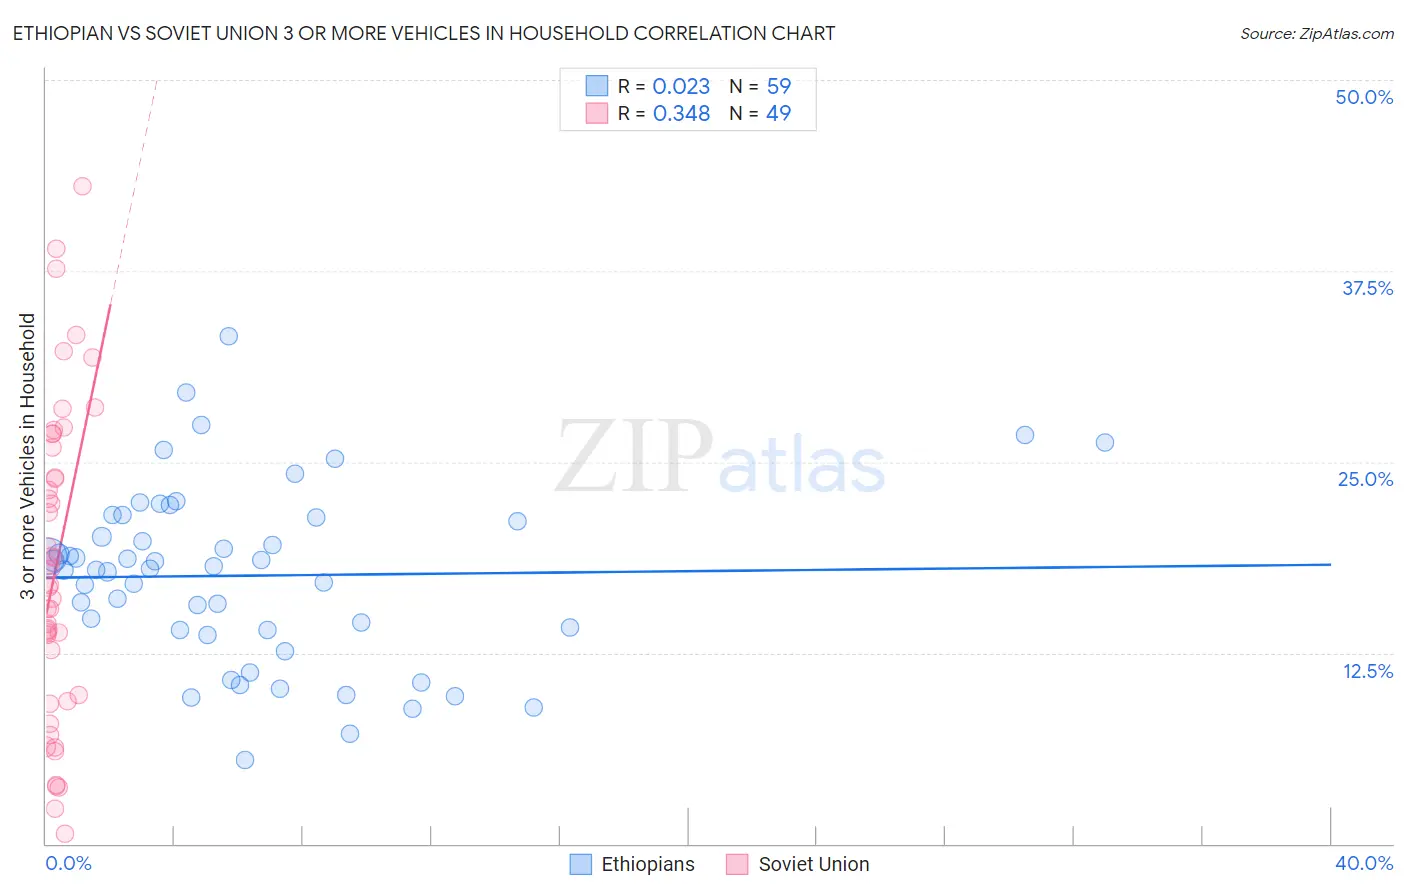
Ethiopian vs Soviet Union 3 or more Vehicles in Household Correlation Chart
The statistical analysis conducted on geographies consisting of 223,058,389 people shows no correlation between the proportion of Ethiopians and percentage of households with 3 or more vehicles available in the United States with a correlation coefficient (R) of 0.023 and weighted average of 17.9%. Similarly, the statistical analysis conducted on geographies consisting of 43,505,589 people shows a mild positive correlation between the proportion of Soviet Union and percentage of households with 3 or more vehicles available in the United States with a correlation coefficient (R) of 0.348 and weighted average of 14.2%, a difference of 26.2%.
3 or more Vehicles in Household Correlation Summary
| Measurement | Ethiopian | Soviet Union |
| Minimum | 5.5% | 0.69% |
| Maximum | 33.2% | 43.0% |
| Range | 27.8% | 42.4% |
| Mean | 17.5% | 18.2% |
| Median | 18.0% | 16.9% |
| Interquartile 25% (IQ1) | 14.0% | 9.5% |
| Interquartile 75% (IQ3) | 21.3% | 26.4% |
| Interquartile Range (IQR) | 7.3% | 16.8% |
| Standard Deviation (Sample) | 5.8% | 10.2% |
| Standard Deviation (Population) | 5.7% | 10.1% |
Similar Demographics by 3 or more Vehicles in Household
Demographics Similar to Ethiopians by 3 or more Vehicles in Household
In terms of 3 or more vehicles in household, the demographic groups most similar to Ethiopians are Immigrants from Ethiopia (17.9%, a difference of 0.0%), Immigrants from Turkey (17.9%, a difference of 0.030%), Subsaharan African (17.9%, a difference of 0.18%), Immigrants from Southern Europe (17.9%, a difference of 0.22%), and Immigrants from Eritrea (17.8%, a difference of 0.23%).
| Demographics | Rating | Rank | 3 or more Vehicles in Household |
| Carpatho Rusyns | 1.9 /100 | #247 | Tragic 18.0% |
| Immigrants | Eastern Africa | 1.8 /100 | #248 | Tragic 18.0% |
| Immigrants | Saudi Arabia | 1.7 /100 | #249 | Tragic 18.0% |
| Venezuelans | 1.7 /100 | #250 | Tragic 18.0% |
| Alsatians | 1.5 /100 | #251 | Tragic 18.0% |
| Immigrants | Southern Europe | 1.4 /100 | #252 | Tragic 17.9% |
| Immigrants | Ethiopia | 1.3 /100 | #253 | Tragic 17.9% |
| Ethiopians | 1.2 /100 | #254 | Tragic 17.9% |
| Immigrants | Turkey | 1.2 /100 | #255 | Tragic 17.9% |
| Sub-Saharan Africans | 1.1 /100 | #256 | Tragic 17.9% |
| Immigrants | Eritrea | 1.1 /100 | #257 | Tragic 17.8% |
| Sudanese | 1.1 /100 | #258 | Tragic 17.8% |
| Uruguayans | 1.0 /100 | #259 | Tragic 17.8% |
| Ugandans | 0.9 /100 | #260 | Tragic 17.8% |
| Immigrants | Northern Africa | 0.9 /100 | #261 | Tragic 17.8% |
Demographics Similar to Soviet Union by 3 or more Vehicles in Household
In terms of 3 or more vehicles in household, the demographic groups most similar to Soviet Union are Senegalese (14.2%, a difference of 0.33%), Immigrants from Yemen (14.2%, a difference of 0.41%), Ecuadorian (14.1%, a difference of 0.89%), Immigrants from Albania (14.0%, a difference of 1.6%), and Immigrants from Caribbean (14.6%, a difference of 2.7%).
| Demographics | Rating | Rank | 3 or more Vehicles in Household |
| Cape Verdeans | 0.0 /100 | #319 | Tragic 15.0% |
| Yup'ik | 0.0 /100 | #320 | Tragic 14.8% |
| Immigrants | Jamaica | 0.0 /100 | #321 | Tragic 14.7% |
| Immigrants | West Indies | 0.0 /100 | #322 | Tragic 14.6% |
| Immigrants | Caribbean | 0.0 /100 | #323 | Tragic 14.6% |
| Immigrants | Yemen | 0.0 /100 | #324 | Tragic 14.2% |
| Senegalese | 0.0 /100 | #325 | Tragic 14.2% |
| Soviet Union | 0.0 /100 | #326 | Tragic 14.2% |
| Ecuadorians | 0.0 /100 | #327 | Tragic 14.1% |
| Immigrants | Albania | 0.0 /100 | #328 | Tragic 14.0% |
| Immigrants | Senegal | 0.0 /100 | #329 | Tragic 13.8% |
| West Indians | 0.0 /100 | #330 | Tragic 13.7% |
| Immigrants | Dominica | 0.0 /100 | #331 | Tragic 13.7% |
| Trinidadians and Tobagonians | 0.0 /100 | #332 | Tragic 13.6% |
| Immigrants | Cabo Verde | 0.0 /100 | #333 | Tragic 13.6% |