Argentinean vs Soviet Union GED/Equivalency
COMPARE
Argentinean
Soviet Union
GED/Equivalency
GED/Equivalency Comparison
Argentineans
Soviet Union
86.7%
GED/EQUIVALENCY
89.7/ 100
METRIC RATING
127th/ 347
METRIC RANK
88.0%
GED/EQUIVALENCY
99.4/ 100
METRIC RATING
54th/ 347
METRIC RANK
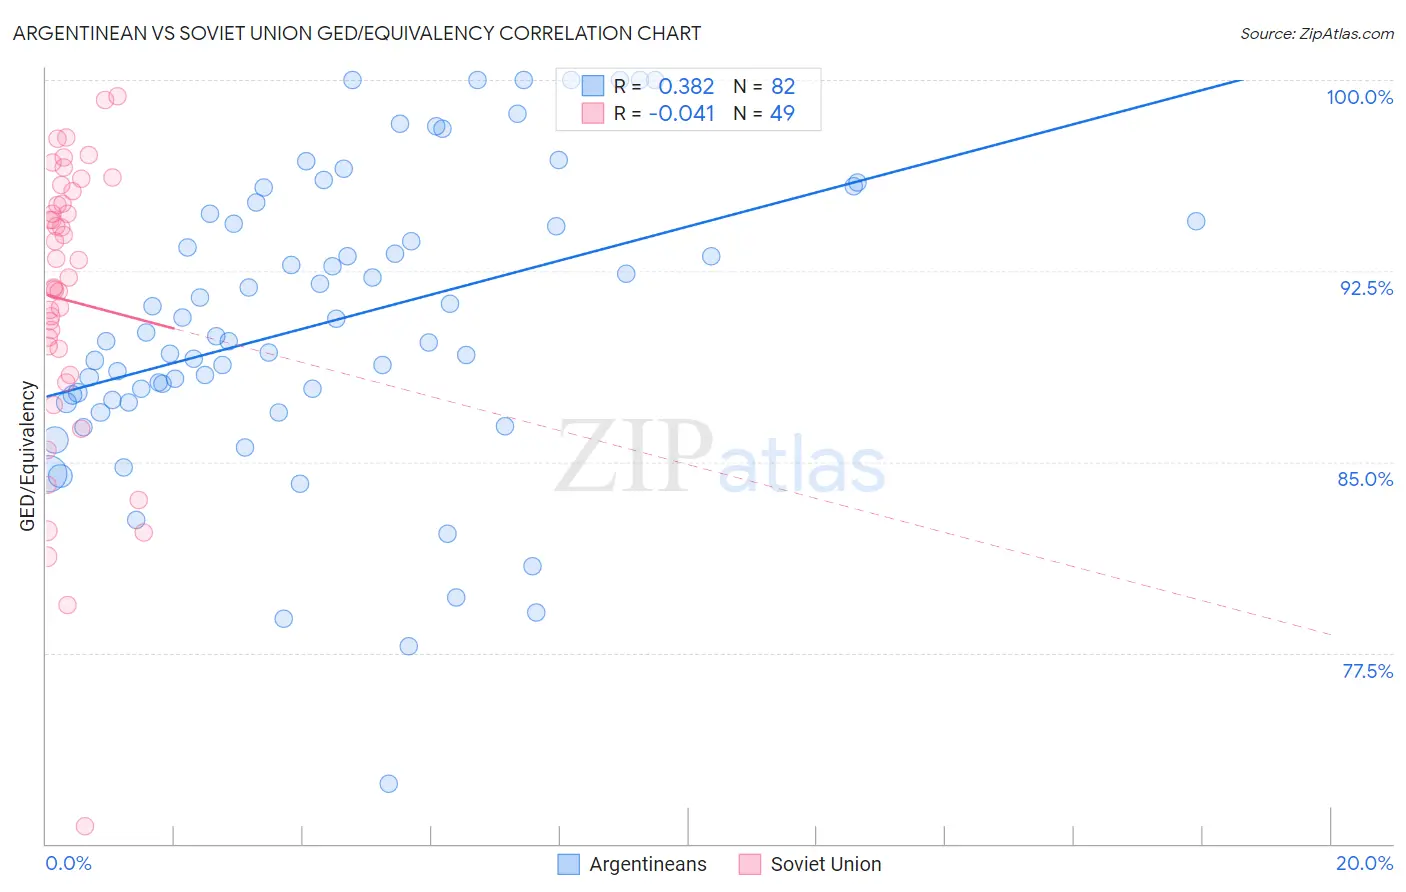
Argentinean vs Soviet Union GED/Equivalency Correlation Chart
The statistical analysis conducted on geographies consisting of 297,143,432 people shows a mild positive correlation between the proportion of Argentineans and percentage of population with at least ged/equivalency education in the United States with a correlation coefficient (R) of 0.382 and weighted average of 86.7%. Similarly, the statistical analysis conducted on geographies consisting of 43,454,395 people shows no correlation between the proportion of Soviet Union and percentage of population with at least ged/equivalency education in the United States with a correlation coefficient (R) of -0.041 and weighted average of 88.0%, a difference of 1.5%.
GED/Equivalency Correlation Summary
| Measurement | Argentinean | Soviet Union |
| Minimum | 72.4% | 70.7% |
| Maximum | 100.0% | 99.4% |
| Range | 27.6% | 28.7% |
| Mean | 90.5% | 91.4% |
| Median | 89.9% | 92.2% |
| Interquartile 25% (IQ1) | 87.5% | 88.9% |
| Interquartile 75% (IQ3) | 94.5% | 95.4% |
| Interquartile Range (IQR) | 7.0% | 6.5% |
| Standard Deviation (Sample) | 5.8% | 5.7% |
| Standard Deviation (Population) | 5.7% | 5.7% |
Similar Demographics by GED/Equivalency
Demographics Similar to Argentineans by GED/Equivalency
In terms of ged/equivalency, the demographic groups most similar to Argentineans are Yugoslavian (86.7%, a difference of 0.010%), Asian (86.7%, a difference of 0.030%), Immigrants from Egypt (86.7%, a difference of 0.040%), Celtic (86.7%, a difference of 0.040%), and Immigrants from Ukraine (86.7%, a difference of 0.040%).
| Demographics | Rating | Rank | GED/Equivalency |
| Scotch-Irish | 91.6 /100 | #120 | Exceptional 86.8% |
| Immigrants | Lebanon | 90.9 /100 | #121 | Exceptional 86.8% |
| Immigrants | Jordan | 90.8 /100 | #122 | Exceptional 86.8% |
| Immigrants | Italy | 90.5 /100 | #123 | Exceptional 86.7% |
| Immigrants | Egypt | 90.4 /100 | #124 | Exceptional 86.7% |
| Celtics | 90.4 /100 | #125 | Exceptional 86.7% |
| Asians | 90.3 /100 | #126 | Exceptional 86.7% |
| Argentineans | 89.7 /100 | #127 | Excellent 86.7% |
| Yugoslavians | 89.5 /100 | #128 | Excellent 86.7% |
| Immigrants | Ukraine | 88.9 /100 | #129 | Excellent 86.7% |
| Immigrants | Germany | 88.8 /100 | #130 | Excellent 86.7% |
| Immigrants | Spain | 88.5 /100 | #131 | Excellent 86.7% |
| Immigrants | Brazil | 88.4 /100 | #132 | Excellent 86.6% |
| Tsimshian | 88.3 /100 | #133 | Excellent 86.6% |
| Albanians | 87.7 /100 | #134 | Excellent 86.6% |
Demographics Similar to Soviet Union by GED/Equivalency
In terms of ged/equivalency, the demographic groups most similar to Soviet Union are New Zealander (88.0%, a difference of 0.0%), Immigrants from Netherlands (88.0%, a difference of 0.010%), Zimbabwean (88.0%, a difference of 0.010%), Immigrants from South Africa (88.0%, a difference of 0.010%), and Immigrants from Denmark (88.0%, a difference of 0.020%).
| Demographics | Rating | Rank | GED/Equivalency |
| Immigrants | Latvia | 99.5 /100 | #47 | Exceptional 88.1% |
| Greeks | 99.5 /100 | #48 | Exceptional 88.1% |
| Australians | 99.5 /100 | #49 | Exceptional 88.1% |
| Immigrants | Korea | 99.5 /100 | #50 | Exceptional 88.1% |
| Immigrants | Netherlands | 99.4 /100 | #51 | Exceptional 88.0% |
| Zimbabweans | 99.4 /100 | #52 | Exceptional 88.0% |
| Immigrants | South Africa | 99.4 /100 | #53 | Exceptional 88.0% |
| Soviet Union | 99.4 /100 | #54 | Exceptional 88.0% |
| New Zealanders | 99.4 /100 | #55 | Exceptional 88.0% |
| Immigrants | Denmark | 99.4 /100 | #56 | Exceptional 88.0% |
| Immigrants | Czechoslovakia | 99.3 /100 | #57 | Exceptional 87.9% |
| Northern Europeans | 99.3 /100 | #58 | Exceptional 87.9% |
| Serbians | 99.3 /100 | #59 | Exceptional 87.9% |
| Scandinavians | 99.3 /100 | #60 | Exceptional 87.9% |
| Europeans | 99.3 /100 | #61 | Exceptional 87.9% |