Immigrants from Congo vs Danish 4 or more Vehicles in Household
COMPARE
Immigrants from Congo
Danish
4 or more Vehicles in Household
4 or more Vehicles in Household Comparison
Immigrants from Congo
Danes
5.2%
4 OR MORE VEHICLES IN HOUSEHOLD
0.1/ 100
METRIC RATING
293rd/ 347
METRIC RANK
8.6%
4 OR MORE VEHICLES IN HOUSEHOLD
100.0/ 100
METRIC RATING
21st/ 347
METRIC RANK
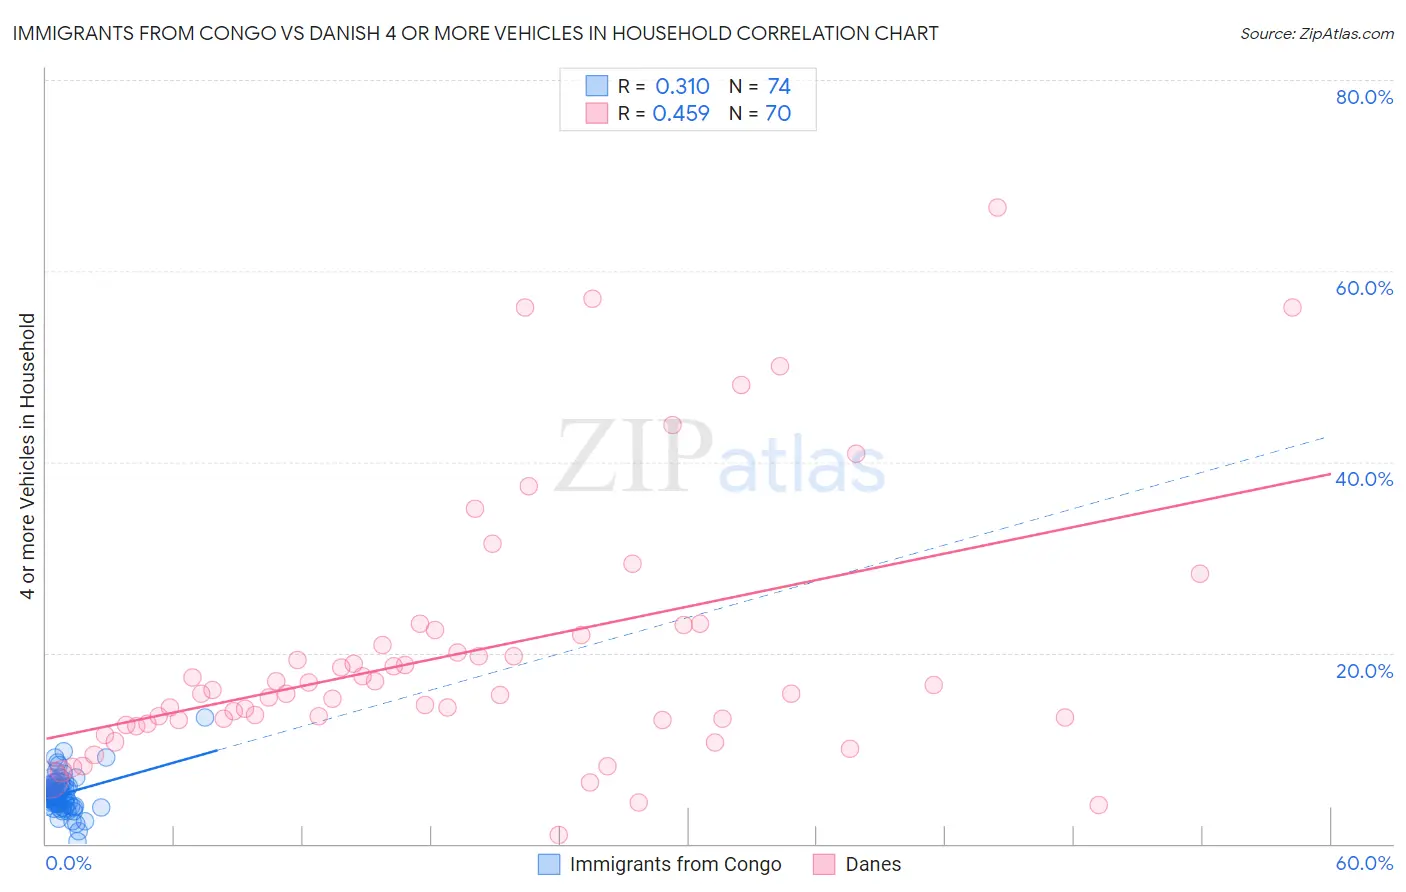
Immigrants from Congo vs Danish 4 or more Vehicles in Household Correlation Chart
The statistical analysis conducted on geographies consisting of 92,027,123 people shows a mild positive correlation between the proportion of Immigrants from Congo and percentage of households with 4 or more vehicles available in the United States with a correlation coefficient (R) of 0.310 and weighted average of 5.2%. Similarly, the statistical analysis conducted on geographies consisting of 472,183,254 people shows a moderate positive correlation between the proportion of Danes and percentage of households with 4 or more vehicles available in the United States with a correlation coefficient (R) of 0.459 and weighted average of 8.6%, a difference of 63.3%.
4 or more Vehicles in Household Correlation Summary
| Measurement | Immigrants from Congo | Danish |
| Minimum | 0.25% | 0.95% |
| Maximum | 13.3% | 66.7% |
| Range | 13.0% | 65.7% |
| Mean | 5.2% | 20.0% |
| Median | 5.0% | 15.7% |
| Interquartile 25% (IQ1) | 4.0% | 12.9% |
| Interquartile 75% (IQ3) | 5.9% | 21.9% |
| Interquartile Range (IQR) | 1.9% | 9.0% |
| Standard Deviation (Sample) | 1.9% | 13.7% |
| Standard Deviation (Population) | 1.9% | 13.6% |
Similar Demographics by 4 or more Vehicles in Household
Demographics Similar to Immigrants from Congo by 4 or more Vehicles in Household
In terms of 4 or more vehicles in household, the demographic groups most similar to Immigrants from Congo are Liberian (5.3%, a difference of 0.030%), Ghanaian (5.2%, a difference of 0.050%), Immigrants from Bahamas (5.3%, a difference of 0.13%), Immigrants from Brazil (5.2%, a difference of 0.17%), and Israeli (5.2%, a difference of 0.35%).
| Demographics | Rating | Rank | 4 or more Vehicles in Household |
| Immigrants | Colombia | 0.2 /100 | #286 | Tragic 5.4% |
| Immigrants | Croatia | 0.2 /100 | #287 | Tragic 5.4% |
| Venezuelans | 0.2 /100 | #288 | Tragic 5.3% |
| Immigrants | Bosnia and Herzegovina | 0.2 /100 | #289 | Tragic 5.3% |
| Immigrants | Russia | 0.2 /100 | #290 | Tragic 5.3% |
| Immigrants | Bahamas | 0.1 /100 | #291 | Tragic 5.3% |
| Liberians | 0.1 /100 | #292 | Tragic 5.3% |
| Immigrants | Congo | 0.1 /100 | #293 | Tragic 5.2% |
| Ghanaians | 0.1 /100 | #294 | Tragic 5.2% |
| Immigrants | Brazil | 0.1 /100 | #295 | Tragic 5.2% |
| Israelis | 0.1 /100 | #296 | Tragic 5.2% |
| Immigrants | Venezuela | 0.1 /100 | #297 | Tragic 5.2% |
| Immigrants | South America | 0.1 /100 | #298 | Tragic 5.2% |
| Immigrants | Ghana | 0.1 /100 | #299 | Tragic 5.2% |
| Immigrants | Morocco | 0.0 /100 | #300 | Tragic 5.1% |
Demographics Similar to Danes by 4 or more Vehicles in Household
In terms of 4 or more vehicles in household, the demographic groups most similar to Danes are Pueblo (8.6%, a difference of 0.050%), Immigrants from Vietnam (8.6%, a difference of 0.050%), Immigrants from Philippines (8.5%, a difference of 0.26%), Korean (8.6%, a difference of 0.87%), and Immigrants from Central America (8.5%, a difference of 1.1%).
| Demographics | Rating | Rank | 4 or more Vehicles in Household |
| Chinese | 100.0 /100 | #14 | Exceptional 8.8% |
| Shoshone | 100.0 /100 | #15 | Exceptional 8.8% |
| Lumbee | 100.0 /100 | #16 | Exceptional 8.8% |
| Ute | 100.0 /100 | #17 | Exceptional 8.8% |
| Nepalese | 100.0 /100 | #18 | Exceptional 8.7% |
| Koreans | 100.0 /100 | #19 | Exceptional 8.6% |
| Pueblo | 100.0 /100 | #20 | Exceptional 8.6% |
| Danes | 100.0 /100 | #21 | Exceptional 8.6% |
| Immigrants | Vietnam | 100.0 /100 | #22 | Exceptional 8.6% |
| Immigrants | Philippines | 100.0 /100 | #23 | Exceptional 8.5% |
| Immigrants | Central America | 100.0 /100 | #24 | Exceptional 8.5% |
| Basques | 100.0 /100 | #25 | Exceptional 8.4% |
| Mexican American Indians | 100.0 /100 | #26 | Exceptional 8.4% |
| Sri Lankans | 100.0 /100 | #27 | Exceptional 8.4% |
| Cheyenne | 100.0 /100 | #28 | Exceptional 8.3% |