Immigrants from West Indies vs Danish 4 or more Vehicles in Household
COMPARE
Immigrants from West Indies
Danish
4 or more Vehicles in Household
4 or more Vehicles in Household Comparison
Immigrants from West Indies
Danes
4.7%
4 OR MORE VEHICLES IN HOUSEHOLD
0.0/ 100
METRIC RATING
314th/ 347
METRIC RANK
8.6%
4 OR MORE VEHICLES IN HOUSEHOLD
100.0/ 100
METRIC RATING
21st/ 347
METRIC RANK
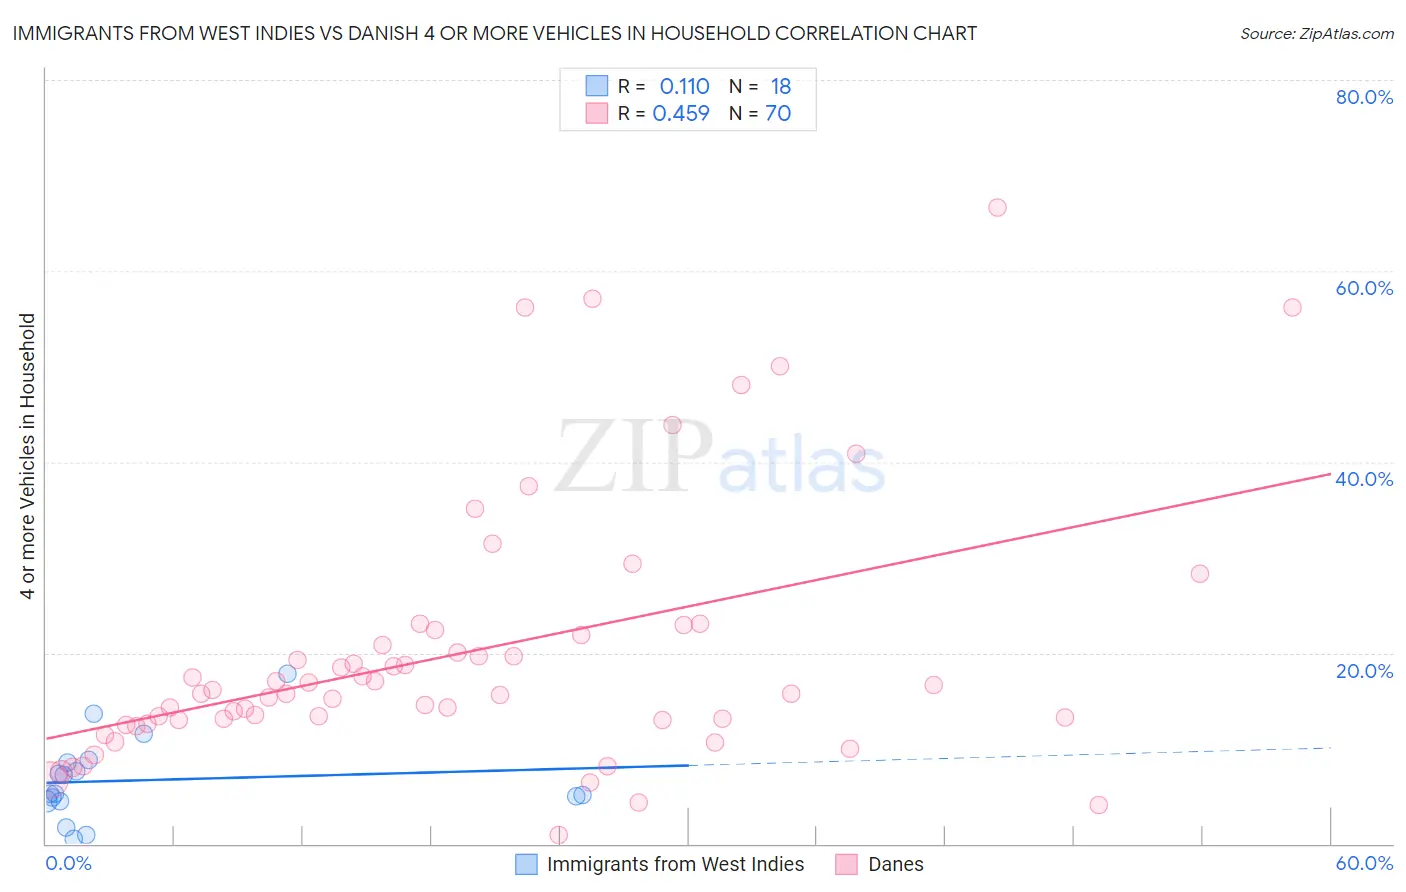
Immigrants from West Indies vs Danish 4 or more Vehicles in Household Correlation Chart
The statistical analysis conducted on geographies consisting of 72,052,209 people shows a poor positive correlation between the proportion of Immigrants from West Indies and percentage of households with 4 or more vehicles available in the United States with a correlation coefficient (R) of 0.110 and weighted average of 4.7%. Similarly, the statistical analysis conducted on geographies consisting of 472,183,254 people shows a moderate positive correlation between the proportion of Danes and percentage of households with 4 or more vehicles available in the United States with a correlation coefficient (R) of 0.459 and weighted average of 8.6%, a difference of 80.6%.
4 or more Vehicles in Household Correlation Summary
| Measurement | Immigrants from West Indies | Danish |
| Minimum | 0.50% | 0.95% |
| Maximum | 17.7% | 66.7% |
| Range | 17.2% | 65.7% |
| Mean | 6.6% | 20.0% |
| Median | 5.3% | 15.7% |
| Interquartile 25% (IQ1) | 4.5% | 12.9% |
| Interquartile 75% (IQ3) | 8.5% | 21.9% |
| Interquartile Range (IQR) | 4.0% | 9.0% |
| Standard Deviation (Sample) | 4.4% | 13.7% |
| Standard Deviation (Population) | 4.2% | 13.6% |
Similar Demographics by 4 or more Vehicles in Household
Demographics Similar to Immigrants from West Indies by 4 or more Vehicles in Household
In terms of 4 or more vehicles in household, the demographic groups most similar to Immigrants from West Indies are Immigrants from Belarus (4.7%, a difference of 0.090%), Puerto Rican (4.7%, a difference of 0.53%), Immigrants from Israel (4.8%, a difference of 0.79%), Albanian (4.8%, a difference of 0.81%), and U.S. Virgin Islander (4.6%, a difference of 2.2%).
| Demographics | Rating | Rank | 4 or more Vehicles in Household |
| Menominee | 0.0 /100 | #307 | Tragic 5.0% |
| Paraguayans | 0.0 /100 | #308 | Tragic 4.9% |
| Immigrants | Somalia | 0.0 /100 | #309 | Tragic 4.9% |
| Moroccans | 0.0 /100 | #310 | Tragic 4.9% |
| Houma | 0.0 /100 | #311 | Tragic 4.9% |
| Albanians | 0.0 /100 | #312 | Tragic 4.8% |
| Immigrants | Israel | 0.0 /100 | #313 | Tragic 4.8% |
| Immigrants | West Indies | 0.0 /100 | #314 | Tragic 4.7% |
| Immigrants | Belarus | 0.0 /100 | #315 | Tragic 4.7% |
| Puerto Ricans | 0.0 /100 | #316 | Tragic 4.7% |
| U.S. Virgin Islanders | 0.0 /100 | #317 | Tragic 4.6% |
| Jamaicans | 0.0 /100 | #318 | Tragic 4.6% |
| Haitians | 0.0 /100 | #319 | Tragic 4.6% |
| Immigrants | Haiti | 0.0 /100 | #320 | Tragic 4.5% |
| Ecuadorians | 0.0 /100 | #321 | Tragic 4.5% |
Demographics Similar to Danes by 4 or more Vehicles in Household
In terms of 4 or more vehicles in household, the demographic groups most similar to Danes are Pueblo (8.6%, a difference of 0.050%), Immigrants from Vietnam (8.6%, a difference of 0.050%), Immigrants from Philippines (8.5%, a difference of 0.26%), Korean (8.6%, a difference of 0.87%), and Immigrants from Central America (8.5%, a difference of 1.1%).
| Demographics | Rating | Rank | 4 or more Vehicles in Household |
| Chinese | 100.0 /100 | #14 | Exceptional 8.8% |
| Shoshone | 100.0 /100 | #15 | Exceptional 8.8% |
| Lumbee | 100.0 /100 | #16 | Exceptional 8.8% |
| Ute | 100.0 /100 | #17 | Exceptional 8.8% |
| Nepalese | 100.0 /100 | #18 | Exceptional 8.7% |
| Koreans | 100.0 /100 | #19 | Exceptional 8.6% |
| Pueblo | 100.0 /100 | #20 | Exceptional 8.6% |
| Danes | 100.0 /100 | #21 | Exceptional 8.6% |
| Immigrants | Vietnam | 100.0 /100 | #22 | Exceptional 8.6% |
| Immigrants | Philippines | 100.0 /100 | #23 | Exceptional 8.5% |
| Immigrants | Central America | 100.0 /100 | #24 | Exceptional 8.5% |
| Basques | 100.0 /100 | #25 | Exceptional 8.4% |
| Mexican American Indians | 100.0 /100 | #26 | Exceptional 8.4% |
| Sri Lankans | 100.0 /100 | #27 | Exceptional 8.4% |
| Cheyenne | 100.0 /100 | #28 | Exceptional 8.3% |