Pima vs Danish 4 or more Vehicles in Household
COMPARE
Pima
Danish
4 or more Vehicles in Household
4 or more Vehicles in Household Comparison
Pima
Danes
7.9%
4 OR MORE VEHICLES IN HOUSEHOLD
100.0/ 100
METRIC RATING
41st/ 347
METRIC RANK
8.6%
4 OR MORE VEHICLES IN HOUSEHOLD
100.0/ 100
METRIC RATING
21st/ 347
METRIC RANK
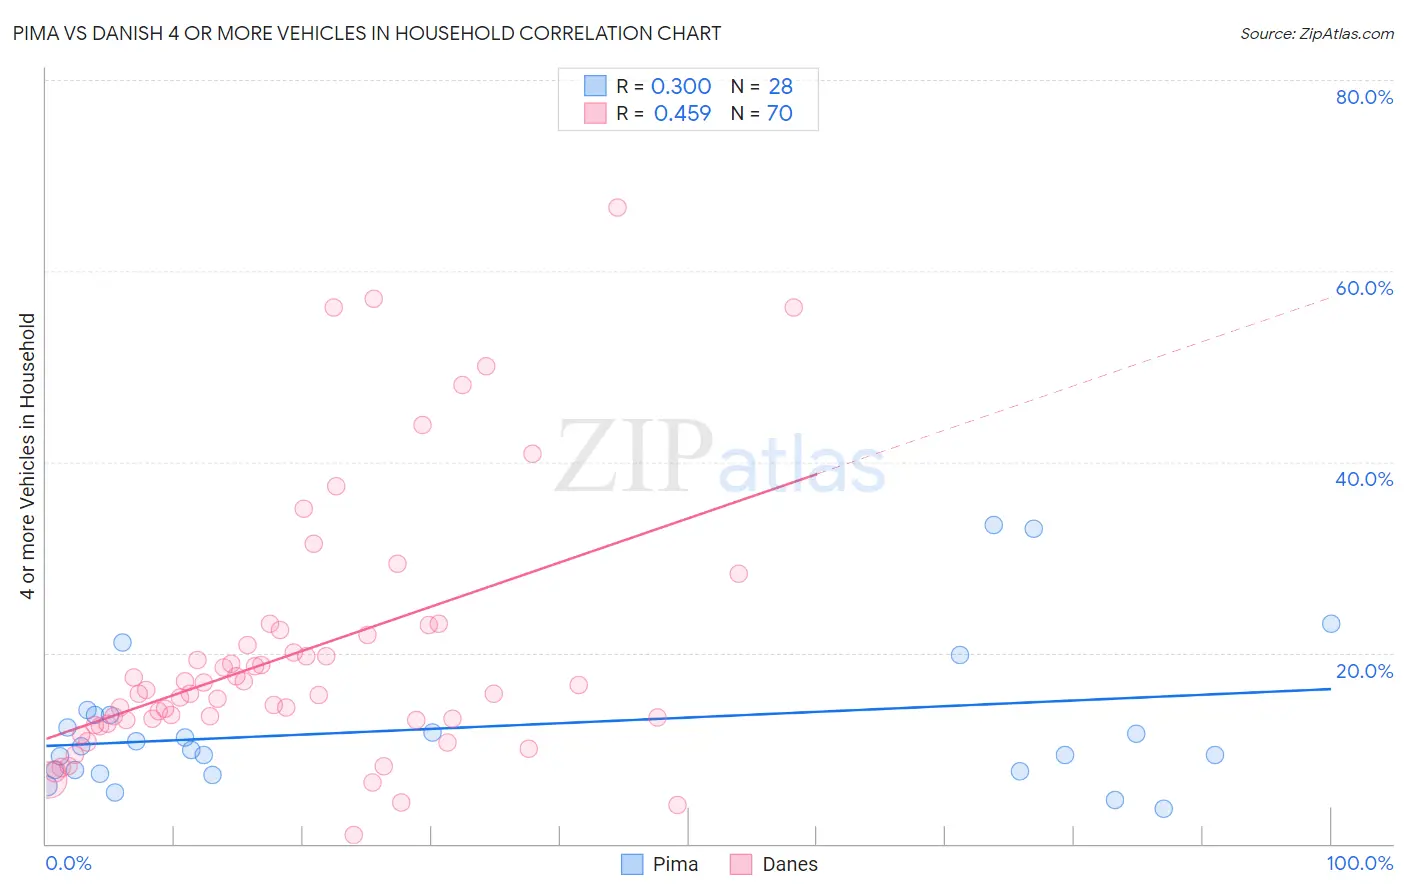
Pima vs Danish 4 or more Vehicles in Household Correlation Chart
The statistical analysis conducted on geographies consisting of 61,524,905 people shows a weak positive correlation between the proportion of Pima and percentage of households with 4 or more vehicles available in the United States with a correlation coefficient (R) of 0.300 and weighted average of 7.9%. Similarly, the statistical analysis conducted on geographies consisting of 472,183,254 people shows a moderate positive correlation between the proportion of Danes and percentage of households with 4 or more vehicles available in the United States with a correlation coefficient (R) of 0.459 and weighted average of 8.6%, a difference of 9.0%.
4 or more Vehicles in Household Correlation Summary
| Measurement | Pima | Danish |
| Minimum | 3.7% | 0.95% |
| Maximum | 33.3% | 66.7% |
| Range | 29.7% | 65.7% |
| Mean | 12.2% | 20.0% |
| Median | 10.0% | 15.7% |
| Interquartile 25% (IQ1) | 7.6% | 12.9% |
| Interquartile 75% (IQ3) | 13.5% | 21.9% |
| Interquartile Range (IQR) | 5.9% | 9.0% |
| Standard Deviation (Sample) | 7.5% | 13.7% |
| Standard Deviation (Population) | 7.4% | 13.6% |
Demographics Similar to Pima and Danes by 4 or more Vehicles in Household
In terms of 4 or more vehicles in household, the demographic groups most similar to Pima are Spanish (7.9%, a difference of 0.57%), Spanish American (8.0%, a difference of 1.2%), Sioux (8.0%, a difference of 1.4%), Scandinavian (8.0%, a difference of 1.5%), and Norwegian (8.0%, a difference of 1.6%). Similarly, the demographic groups most similar to Danes are Immigrants from Vietnam (8.6%, a difference of 0.050%), Immigrants from Philippines (8.5%, a difference of 0.26%), Immigrants from Central America (8.5%, a difference of 1.1%), Basque (8.4%, a difference of 1.6%), and Mexican American Indian (8.4%, a difference of 2.0%).
| Demographics | Rating | Rank | 4 or more Vehicles in Household |
| Danes | 100.0 /100 | #21 | Exceptional 8.6% |
| Immigrants | Vietnam | 100.0 /100 | #22 | Exceptional 8.6% |
| Immigrants | Philippines | 100.0 /100 | #23 | Exceptional 8.5% |
| Immigrants | Central America | 100.0 /100 | #24 | Exceptional 8.5% |
| Basques | 100.0 /100 | #25 | Exceptional 8.4% |
| Mexican American Indians | 100.0 /100 | #26 | Exceptional 8.4% |
| Sri Lankans | 100.0 /100 | #27 | Exceptional 8.4% |
| Cheyenne | 100.0 /100 | #28 | Exceptional 8.3% |
| Immigrants | South Eastern Asia | 100.0 /100 | #29 | Exceptional 8.2% |
| Navajo | 100.0 /100 | #30 | Exceptional 8.2% |
| Natives/Alaskans | 100.0 /100 | #31 | Exceptional 8.2% |
| Marshallese | 100.0 /100 | #32 | Exceptional 8.1% |
| Yaqui | 100.0 /100 | #33 | Exceptional 8.1% |
| Alaskan Athabascans | 100.0 /100 | #34 | Exceptional 8.1% |
| Guamanians/Chamorros | 100.0 /100 | #35 | Exceptional 8.1% |
| Norwegians | 100.0 /100 | #36 | Exceptional 8.0% |
| Scandinavians | 100.0 /100 | #37 | Exceptional 8.0% |
| Sioux | 100.0 /100 | #38 | Exceptional 8.0% |
| Spanish Americans | 100.0 /100 | #39 | Exceptional 8.0% |
| Spanish | 100.0 /100 | #40 | Exceptional 7.9% |
| Pima | 100.0 /100 | #41 | Exceptional 7.9% |