Aleut vs Danish 2 or more Vehicles in Household
COMPARE
Aleut
Danish
2 or more Vehicles in Household
2 or more Vehicles in Household Comparison
Aleuts
Danes
54.1%
2 OR MORE VEHICLES IN HOUSEHOLD
9.3/ 100
METRIC RATING
215th/ 347
METRIC RANK
63.3%
2 OR MORE VEHICLES IN HOUSEHOLD
100.0/ 100
METRIC RATING
3rd/ 347
METRIC RANK
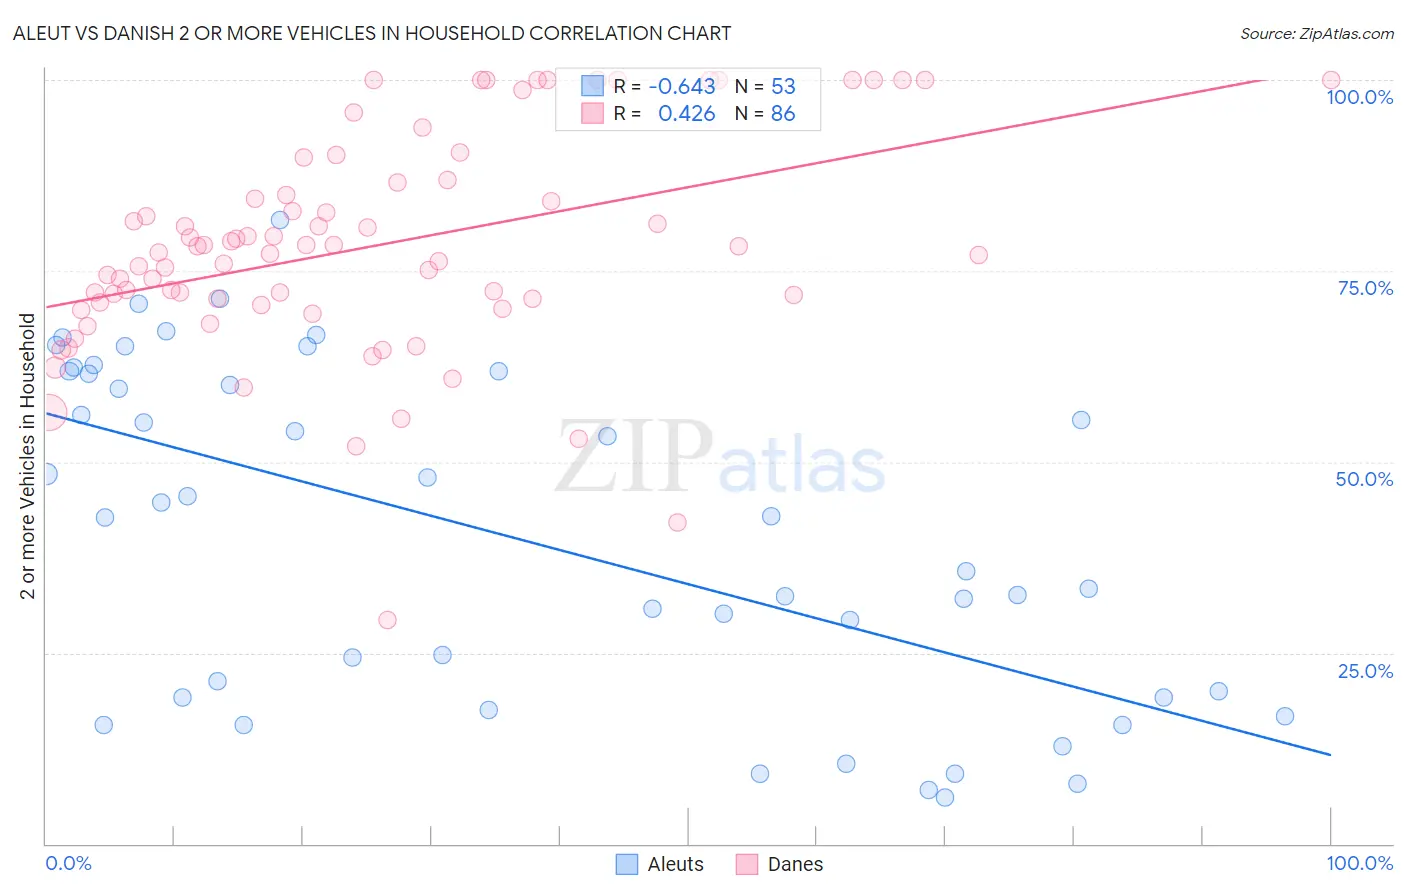
Aleut vs Danish 2 or more Vehicles in Household Correlation Chart
The statistical analysis conducted on geographies consisting of 61,767,595 people shows a significant negative correlation between the proportion of Aleuts and percentage of households with 2 or more vehicles available in the United States with a correlation coefficient (R) of -0.643 and weighted average of 54.1%. Similarly, the statistical analysis conducted on geographies consisting of 473,941,162 people shows a moderate positive correlation between the proportion of Danes and percentage of households with 2 or more vehicles available in the United States with a correlation coefficient (R) of 0.426 and weighted average of 63.3%, a difference of 17.0%.
2 or more Vehicles in Household Correlation Summary
| Measurement | Aleut | Danish |
| Minimum | 6.1% | 29.2% |
| Maximum | 81.6% | 100.0% |
| Range | 75.6% | 70.8% |
| Mean | 40.1% | 78.2% |
| Median | 42.7% | 77.8% |
| Interquartile 25% (IQ1) | 19.2% | 70.9% |
| Interquartile 75% (IQ3) | 61.7% | 86.6% |
| Interquartile Range (IQR) | 42.5% | 15.8% |
| Standard Deviation (Sample) | 21.7% | 14.3% |
| Standard Deviation (Population) | 21.5% | 14.2% |
Similar Demographics by 2 or more Vehicles in Household
Demographics Similar to Aleuts by 2 or more Vehicles in Household
In terms of 2 or more vehicles in household, the demographic groups most similar to Aleuts are Immigrants from Western Asia (54.1%, a difference of 0.0%), Immigrants from Czechoslovakia (54.1%, a difference of 0.010%), Guatemalan (54.1%, a difference of 0.030%), Immigrants from Chile (54.2%, a difference of 0.20%), and Immigrants from Hungary (54.2%, a difference of 0.22%).
| Demographics | Rating | Rank | 2 or more Vehicles in Household |
| Egyptians | 12.0 /100 | #208 | Poor 54.3% |
| Immigrants | Bulgaria | 12.0 /100 | #209 | Poor 54.3% |
| Immigrants | Saudi Arabia | 11.3 /100 | #210 | Poor 54.2% |
| Immigrants | Hungary | 11.3 /100 | #211 | Poor 54.2% |
| Immigrants | Chile | 11.1 /100 | #212 | Poor 54.2% |
| Guatemalans | 9.6 /100 | #213 | Tragic 54.1% |
| Immigrants | Czechoslovakia | 9.4 /100 | #214 | Tragic 54.1% |
| Aleuts | 9.3 /100 | #215 | Tragic 54.1% |
| Immigrants | Western Asia | 9.3 /100 | #216 | Tragic 54.1% |
| Immigrants | Burma/Myanmar | 7.1 /100 | #217 | Tragic 53.9% |
| Immigrants | Argentina | 6.8 /100 | #218 | Tragic 53.9% |
| South American Indians | 6.5 /100 | #219 | Tragic 53.9% |
| Taiwanese | 6.3 /100 | #220 | Tragic 53.9% |
| Immigrants | Singapore | 6.3 /100 | #221 | Tragic 53.9% |
| Kiowa | 6.2 /100 | #222 | Tragic 53.9% |
Demographics Similar to Danes by 2 or more Vehicles in Household
In terms of 2 or more vehicles in household, the demographic groups most similar to Danes are Tongan (63.5%, a difference of 0.37%), Norwegian (62.8%, a difference of 0.69%), Immigrants from Fiji (62.3%, a difference of 1.6%), Scandinavian (62.1%, a difference of 1.9%), and Puget Sound Salish (62.1%, a difference of 2.0%).
| Demographics | Rating | Rank | 2 or more Vehicles in Household |
| Yakama | 100.0 /100 | #1 | Exceptional 64.9% |
| Tongans | 100.0 /100 | #2 | Exceptional 63.5% |
| Danes | 100.0 /100 | #3 | Exceptional 63.3% |
| Norwegians | 100.0 /100 | #4 | Exceptional 62.8% |
| Immigrants | Fiji | 100.0 /100 | #5 | Exceptional 62.3% |
| Scandinavians | 100.0 /100 | #6 | Exceptional 62.1% |
| Puget Sound Salish | 100.0 /100 | #7 | Exceptional 62.1% |
| English | 100.0 /100 | #8 | Exceptional 61.9% |
| Swedes | 100.0 /100 | #9 | Exceptional 61.8% |
| Mexicans | 100.0 /100 | #10 | Exceptional 61.7% |
| Dutch | 100.0 /100 | #11 | Exceptional 61.6% |
| Germans | 100.0 /100 | #12 | Exceptional 61.6% |
| Samoans | 100.0 /100 | #13 | Exceptional 61.5% |
| Czechs | 100.0 /100 | #14 | Exceptional 61.5% |
| Nepalese | 100.0 /100 | #15 | Exceptional 61.4% |