Alaska Native vs Immigrants from Ghana Unemployment Among Ages 16 to 19 years
COMPARE
Alaska Native
Immigrants from Ghana
Unemployment Among Ages 16 to 19 years
Unemployment Among Ages 16 to 19 years Comparison
Alaska Natives
Immigrants from Ghana
21.8%
UNEMPLOYMENT AMONG AGES 16 TO 19 YEARS
0.0/ 100
METRIC RATING
314th/ 347
METRIC RANK
19.8%
UNEMPLOYMENT AMONG AGES 16 TO 19 YEARS
0.0/ 100
METRIC RATING
287th/ 347
METRIC RANK
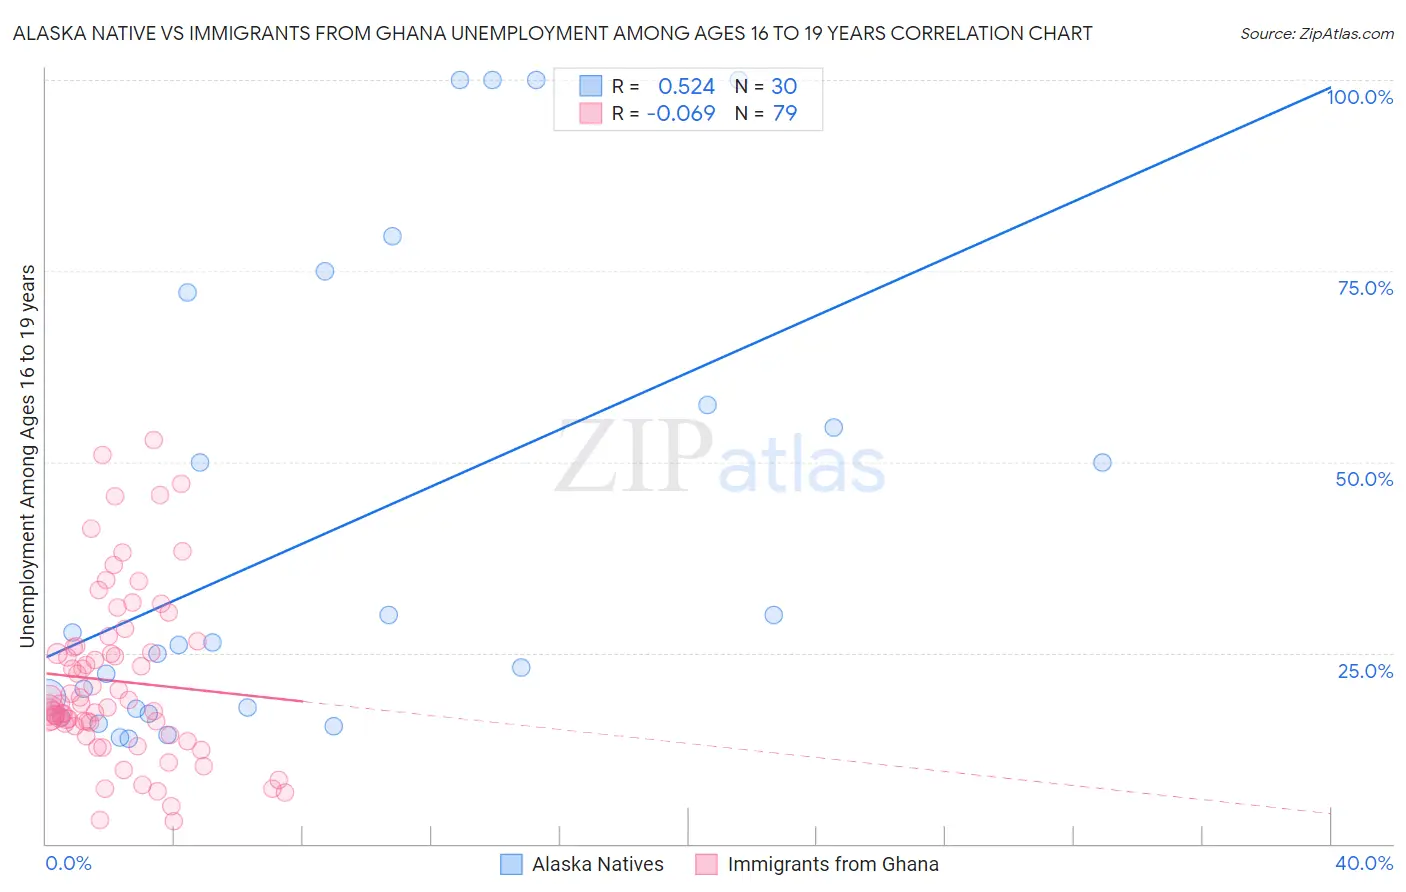
Alaska Native vs Immigrants from Ghana Unemployment Among Ages 16 to 19 years Correlation Chart
The statistical analysis conducted on geographies consisting of 76,044,385 people shows a substantial positive correlation between the proportion of Alaska Natives and unemployment rate among population between the ages 16 and 19 in the United States with a correlation coefficient (R) of 0.524 and weighted average of 21.8%. Similarly, the statistical analysis conducted on geographies consisting of 195,838,231 people shows a slight negative correlation between the proportion of Immigrants from Ghana and unemployment rate among population between the ages 16 and 19 in the United States with a correlation coefficient (R) of -0.069 and weighted average of 19.8%, a difference of 9.9%.
Unemployment Among Ages 16 to 19 years Correlation Summary
| Measurement | Alaska Native | Immigrants from Ghana |
| Minimum | 13.8% | 3.0% |
| Maximum | 100.0% | 52.9% |
| Range | 86.2% | 49.9% |
| Mean | 41.0% | 21.3% |
| Median | 26.2% | 18.4% |
| Interquartile 25% (IQ1) | 17.7% | 15.4% |
| Interquartile 75% (IQ3) | 57.5% | 25.9% |
| Interquartile Range (IQR) | 39.7% | 10.5% |
| Standard Deviation (Sample) | 30.3% | 11.0% |
| Standard Deviation (Population) | 29.8% | 10.9% |
Similar Demographics by Unemployment Among Ages 16 to 19 years
Demographics Similar to Alaska Natives by Unemployment Among Ages 16 to 19 years
In terms of unemployment among ages 16 to 19 years, the demographic groups most similar to Alaska Natives are Jamaican (21.7%, a difference of 0.16%), Houma (21.6%, a difference of 0.58%), Belizean (21.6%, a difference of 0.84%), Immigrants from Dominica (21.9%, a difference of 0.85%), and Vietnamese (21.5%, a difference of 1.1%).
| Demographics | Rating | Rank | Unemployment Among Ages 16 to 19 years |
| Blacks/African Americans | 0.0 /100 | #307 | Tragic 21.4% |
| Immigrants | Bangladesh | 0.0 /100 | #308 | Tragic 21.5% |
| Natives/Alaskans | 0.0 /100 | #309 | Tragic 21.5% |
| Vietnamese | 0.0 /100 | #310 | Tragic 21.5% |
| Belizeans | 0.0 /100 | #311 | Tragic 21.6% |
| Houma | 0.0 /100 | #312 | Tragic 21.6% |
| Jamaicans | 0.0 /100 | #313 | Tragic 21.7% |
| Alaska Natives | 0.0 /100 | #314 | Tragic 21.8% |
| Immigrants | Dominica | 0.0 /100 | #315 | Tragic 21.9% |
| Tohono O'odham | 0.0 /100 | #316 | Tragic 22.1% |
| Immigrants | Belize | 0.0 /100 | #317 | Tragic 22.2% |
| Immigrants | Jamaica | 0.0 /100 | #318 | Tragic 22.2% |
| Immigrants | West Indies | 0.0 /100 | #319 | Tragic 22.2% |
| Cheyenne | 0.0 /100 | #320 | Tragic 22.3% |
| West Indians | 0.0 /100 | #321 | Tragic 22.4% |
Demographics Similar to Immigrants from Ghana by Unemployment Among Ages 16 to 19 years
In terms of unemployment among ages 16 to 19 years, the demographic groups most similar to Immigrants from Ghana are Bahamian (19.8%, a difference of 0.060%), Immigrants from the Azores (19.8%, a difference of 0.12%), Ghanaian (19.8%, a difference of 0.19%), Pueblo (19.8%, a difference of 0.29%), and Sierra Leonean (19.7%, a difference of 0.37%).
| Demographics | Rating | Rank | Unemployment Among Ages 16 to 19 years |
| Cajuns | 0.0 /100 | #280 | Tragic 19.6% |
| Cypriots | 0.0 /100 | #281 | Tragic 19.6% |
| Dutch West Indians | 0.0 /100 | #282 | Tragic 19.7% |
| Sioux | 0.0 /100 | #283 | Tragic 19.7% |
| Sierra Leoneans | 0.0 /100 | #284 | Tragic 19.7% |
| Ghanaians | 0.0 /100 | #285 | Tragic 19.8% |
| Bahamians | 0.0 /100 | #286 | Tragic 19.8% |
| Immigrants | Ghana | 0.0 /100 | #287 | Tragic 19.8% |
| Immigrants | Azores | 0.0 /100 | #288 | Tragic 19.8% |
| Pueblo | 0.0 /100 | #289 | Tragic 19.8% |
| Immigrants | Sierra Leone | 0.0 /100 | #290 | Tragic 20.0% |
| Immigrants | Yemen | 0.0 /100 | #291 | Tragic 20.0% |
| Comanche | 0.0 /100 | #292 | Tragic 20.2% |
| Immigrants | Bahamas | 0.0 /100 | #293 | Tragic 20.4% |
| Immigrants | Haiti | 0.0 /100 | #294 | Tragic 20.4% |