Alaska Native vs Immigrants from Ghana Associate's Degree
COMPARE
Alaska Native
Immigrants from Ghana
Associate's Degree
Associate's Degree Comparison
Alaska Natives
Immigrants from Ghana
37.5%
ASSOCIATE'S DEGREE
0.0/ 100
METRIC RATING
318th/ 347
METRIC RANK
44.8%
ASSOCIATE'S DEGREE
14.2/ 100
METRIC RATING
213th/ 347
METRIC RANK
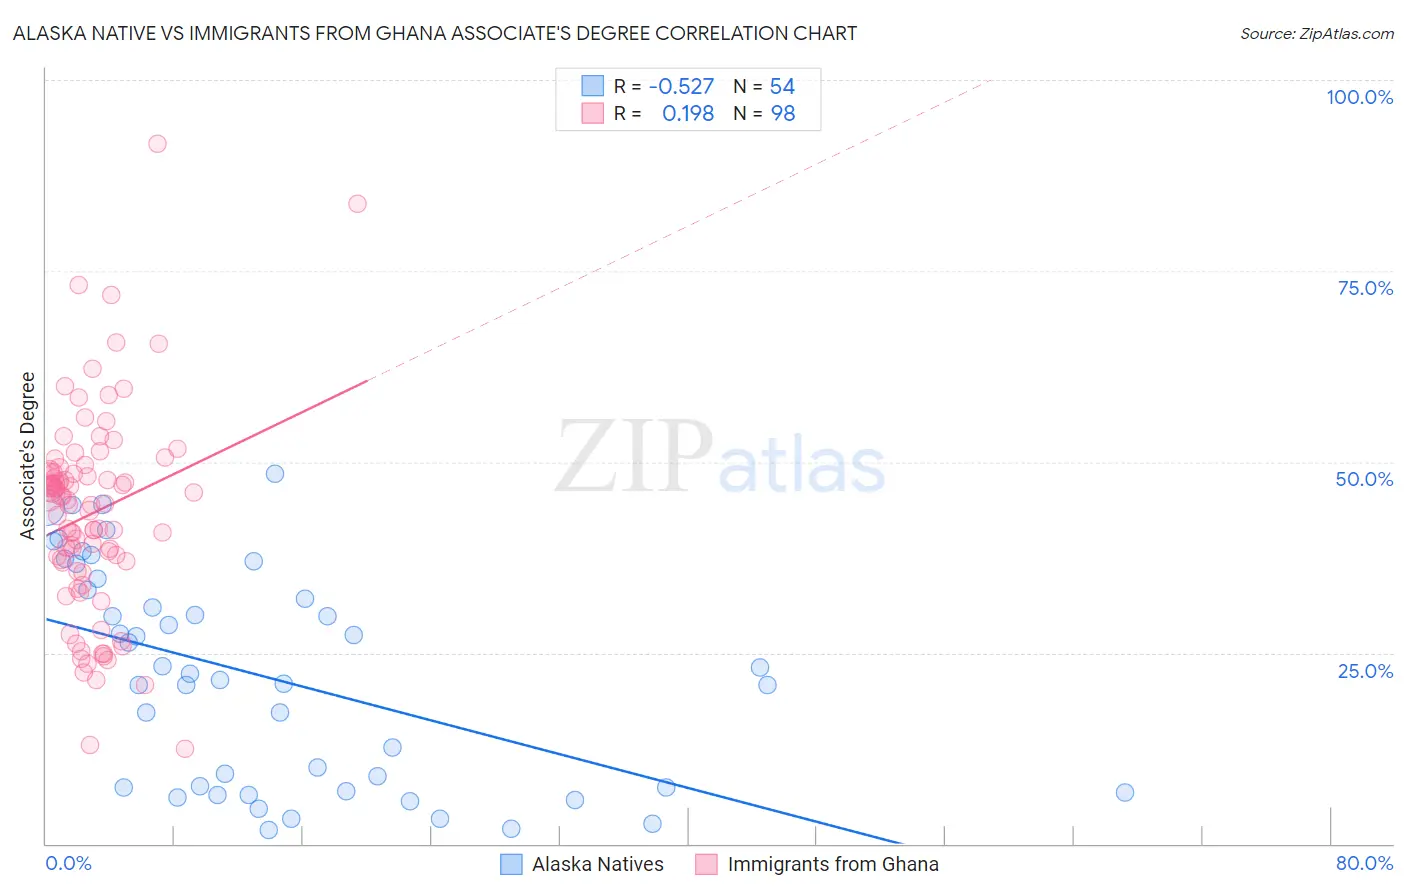
Alaska Native vs Immigrants from Ghana Associate's Degree Correlation Chart
The statistical analysis conducted on geographies consisting of 76,777,220 people shows a substantial negative correlation between the proportion of Alaska Natives and percentage of population with at least associate's degree education in the United States with a correlation coefficient (R) of -0.527 and weighted average of 37.5%. Similarly, the statistical analysis conducted on geographies consisting of 199,944,026 people shows a poor positive correlation between the proportion of Immigrants from Ghana and percentage of population with at least associate's degree education in the United States with a correlation coefficient (R) of 0.198 and weighted average of 44.8%, a difference of 19.6%.
Associate's Degree Correlation Summary
| Measurement | Alaska Native | Immigrants from Ghana |
| Minimum | 1.8% | 12.5% |
| Maximum | 48.5% | 91.7% |
| Range | 46.7% | 79.2% |
| Mean | 21.8% | 43.2% |
| Median | 21.9% | 44.8% |
| Interquartile 25% (IQ1) | 7.3% | 36.9% |
| Interquartile 75% (IQ3) | 33.2% | 48.6% |
| Interquartile Range (IQR) | 25.9% | 11.7% |
| Standard Deviation (Sample) | 14.0% | 13.5% |
| Standard Deviation (Population) | 13.9% | 13.4% |
Similar Demographics by Associate's Degree
Demographics Similar to Alaska Natives by Associate's Degree
In terms of associate's degree, the demographic groups most similar to Alaska Natives are Fijian (37.4%, a difference of 0.22%), Yaqui (37.6%, a difference of 0.23%), Crow (37.6%, a difference of 0.25%), Cajun (37.4%, a difference of 0.25%), and Creek (37.6%, a difference of 0.26%).
| Demographics | Rating | Rank | Associate's Degree |
| Immigrants | Latin America | 0.0 /100 | #311 | Tragic 37.9% |
| Choctaw | 0.0 /100 | #312 | Tragic 37.8% |
| Hispanics or Latinos | 0.0 /100 | #313 | Tragic 37.7% |
| Seminole | 0.0 /100 | #314 | Tragic 37.7% |
| Creek | 0.0 /100 | #315 | Tragic 37.6% |
| Crow | 0.0 /100 | #316 | Tragic 37.6% |
| Yaqui | 0.0 /100 | #317 | Tragic 37.6% |
| Alaska Natives | 0.0 /100 | #318 | Tragic 37.5% |
| Fijians | 0.0 /100 | #319 | Tragic 37.4% |
| Cajuns | 0.0 /100 | #320 | Tragic 37.4% |
| Immigrants | Yemen | 0.0 /100 | #321 | Tragic 37.3% |
| Pennsylvania Germans | 0.0 /100 | #322 | Tragic 37.2% |
| Immigrants | Cabo Verde | 0.0 /100 | #323 | Tragic 36.8% |
| Arapaho | 0.0 /100 | #324 | Tragic 36.7% |
| Menominee | 0.0 /100 | #325 | Tragic 36.7% |
Demographics Similar to Immigrants from Ghana by Associate's Degree
In terms of associate's degree, the demographic groups most similar to Immigrants from Ghana are French Canadian (44.9%, a difference of 0.12%), Immigrants from Middle Africa (44.7%, a difference of 0.25%), Immigrants from Panama (44.7%, a difference of 0.31%), Immigrants from Zaire (45.0%, a difference of 0.35%), and Immigrants from Philippines (45.0%, a difference of 0.36%).
| Demographics | Rating | Rank | Associate's Degree |
| German Russians | 18.9 /100 | #206 | Poor 45.1% |
| Panamanians | 18.4 /100 | #207 | Poor 45.1% |
| Dutch | 17.6 /100 | #208 | Poor 45.0% |
| Immigrants | Costa Rica | 16.7 /100 | #209 | Poor 45.0% |
| Immigrants | Philippines | 16.7 /100 | #210 | Poor 45.0% |
| Immigrants | Zaire | 16.6 /100 | #211 | Poor 45.0% |
| French Canadians | 15.0 /100 | #212 | Poor 44.9% |
| Immigrants | Ghana | 14.2 /100 | #213 | Poor 44.8% |
| Immigrants | Middle Africa | 12.7 /100 | #214 | Poor 44.7% |
| Immigrants | Panama | 12.4 /100 | #215 | Poor 44.7% |
| Immigrants | Nigeria | 11.4 /100 | #216 | Poor 44.6% |
| Immigrants | Immigrants | 10.5 /100 | #217 | Poor 44.5% |
| Spanish | 9.4 /100 | #218 | Tragic 44.4% |
| Whites/Caucasians | 7.5 /100 | #219 | Tragic 44.2% |
| Portuguese | 7.2 /100 | #220 | Tragic 44.1% |