African vs Immigrants from India 4 or more Vehicles in Household
COMPARE
African
Immigrants from India
4 or more Vehicles in Household
4 or more Vehicles in Household Comparison
Africans
Immigrants from India
5.8%
4 OR MORE VEHICLES IN HOUSEHOLD
4.6/ 100
METRIC RATING
234th/ 347
METRIC RANK
6.3%
4 OR MORE VEHICLES IN HOUSEHOLD
51.9/ 100
METRIC RATING
171st/ 347
METRIC RANK
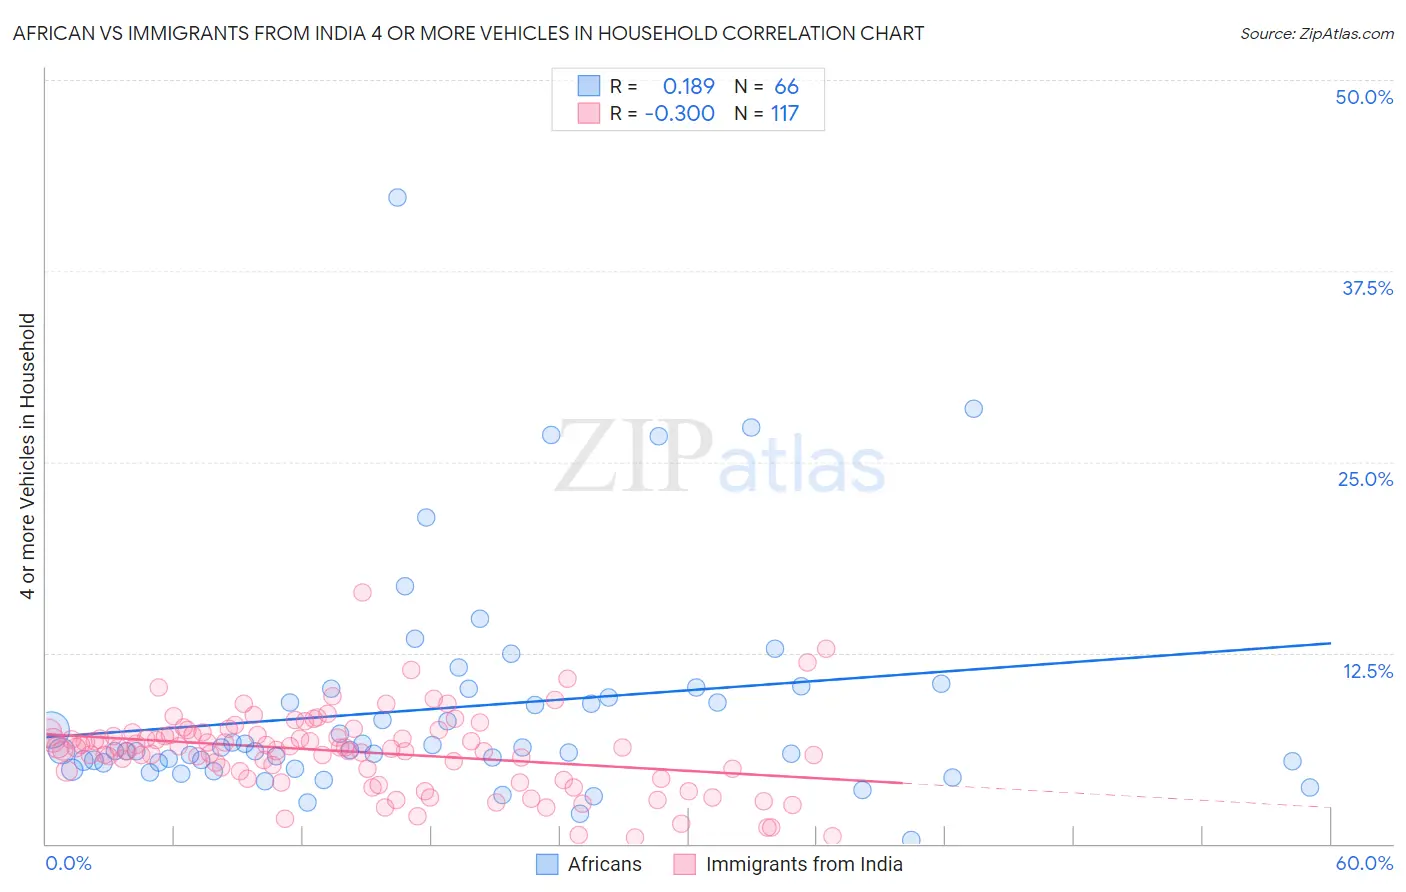
African vs Immigrants from India 4 or more Vehicles in Household Correlation Chart
The statistical analysis conducted on geographies consisting of 467,634,971 people shows a poor positive correlation between the proportion of Africans and percentage of households with 4 or more vehicles available in the United States with a correlation coefficient (R) of 0.189 and weighted average of 5.8%. Similarly, the statistical analysis conducted on geographies consisting of 431,878,521 people shows a mild negative correlation between the proportion of Immigrants from India and percentage of households with 4 or more vehicles available in the United States with a correlation coefficient (R) of -0.300 and weighted average of 6.3%, a difference of 8.5%.
4 or more Vehicles in Household Correlation Summary
| Measurement | African | Immigrants from India |
| Minimum | 0.25% | 0.38% |
| Maximum | 42.3% | 16.5% |
| Range | 42.1% | 16.1% |
| Mean | 8.9% | 6.0% |
| Median | 6.1% | 6.3% |
| Interquartile 25% (IQ1) | 5.4% | 4.5% |
| Interquartile 75% (IQ3) | 10.2% | 7.2% |
| Interquartile Range (IQR) | 4.8% | 2.8% |
| Standard Deviation (Sample) | 7.3% | 2.6% |
| Standard Deviation (Population) | 7.2% | 2.6% |
Similar Demographics by 4 or more Vehicles in Household
Demographics Similar to Africans by 4 or more Vehicles in Household
In terms of 4 or more vehicles in household, the demographic groups most similar to Africans are Immigrants from Hungary (5.8%, a difference of 0.020%), Immigrants from Eritrea (5.8%, a difference of 0.030%), Turkish (5.8%, a difference of 0.31%), Immigrants from Belgium (5.8%, a difference of 0.44%), and Immigrants from Australia (5.8%, a difference of 0.53%).
| Demographics | Rating | Rank | 4 or more Vehicles in Household |
| Immigrants | Western Asia | 7.8 /100 | #227 | Tragic 5.9% |
| Immigrants | Uganda | 7.5 /100 | #228 | Tragic 5.9% |
| Eastern Europeans | 6.8 /100 | #229 | Tragic 5.9% |
| Immigrants | Malaysia | 6.7 /100 | #230 | Tragic 5.9% |
| Immigrants | Switzerland | 6.4 /100 | #231 | Tragic 5.9% |
| Immigrants | Argentina | 6.0 /100 | #232 | Tragic 5.9% |
| Sierra Leoneans | 6.0 /100 | #233 | Tragic 5.9% |
| Africans | 4.6 /100 | #234 | Tragic 5.8% |
| Immigrants | Hungary | 4.6 /100 | #235 | Tragic 5.8% |
| Immigrants | Eritrea | 4.5 /100 | #236 | Tragic 5.8% |
| Turks | 4.1 /100 | #237 | Tragic 5.8% |
| Immigrants | Belgium | 4.0 /100 | #238 | Tragic 5.8% |
| Immigrants | Australia | 3.8 /100 | #239 | Tragic 5.8% |
| Immigrants | Poland | 3.8 /100 | #240 | Tragic 5.8% |
| Mongolians | 3.7 /100 | #241 | Tragic 5.8% |
Demographics Similar to Immigrants from India by 4 or more Vehicles in Household
In terms of 4 or more vehicles in household, the demographic groups most similar to Immigrants from India are Immigrants from Lebanon (6.3%, a difference of 0.020%), Immigrants from Syria (6.3%, a difference of 0.080%), Slovene (6.3%, a difference of 0.080%), Lithuanian (6.3%, a difference of 0.20%), and Estonian (6.4%, a difference of 0.32%).
| Demographics | Rating | Rank | 4 or more Vehicles in Household |
| Hungarians | 61.1 /100 | #164 | Good 6.4% |
| Immigrants | Peru | 59.8 /100 | #165 | Average 6.4% |
| Immigrants | Denmark | 57.8 /100 | #166 | Average 6.4% |
| Poles | 56.9 /100 | #167 | Average 6.4% |
| Lebanese | 55.8 /100 | #168 | Average 6.4% |
| Estonians | 55.1 /100 | #169 | Average 6.4% |
| Immigrants | Syria | 52.8 /100 | #170 | Average 6.3% |
| Immigrants | India | 51.9 /100 | #171 | Average 6.3% |
| Immigrants | Lebanon | 51.7 /100 | #172 | Average 6.3% |
| Slovenes | 51.1 /100 | #173 | Average 6.3% |
| Lithuanians | 50.0 /100 | #174 | Average 6.3% |
| Immigrants | Western Europe | 48.8 /100 | #175 | Average 6.3% |
| Ukrainians | 47.6 /100 | #176 | Average 6.3% |
| Slovaks | 46.9 /100 | #177 | Average 6.3% |
| Belizeans | 44.5 /100 | #178 | Average 6.3% |