African vs Immigrants from India In Labor Force | Age 25-29
COMPARE
African
Immigrants from India
In Labor Force | Age 25-29
In Labor Force | Age 25-29 Comparison
Africans
Immigrants from India
83.2%
IN LABOR FORCE | AGE 25-29
0.0/ 100
METRIC RATING
277th/ 347
METRIC RANK
85.7%
IN LABOR FORCE | AGE 25-29
99.9/ 100
METRIC RATING
43rd/ 347
METRIC RANK
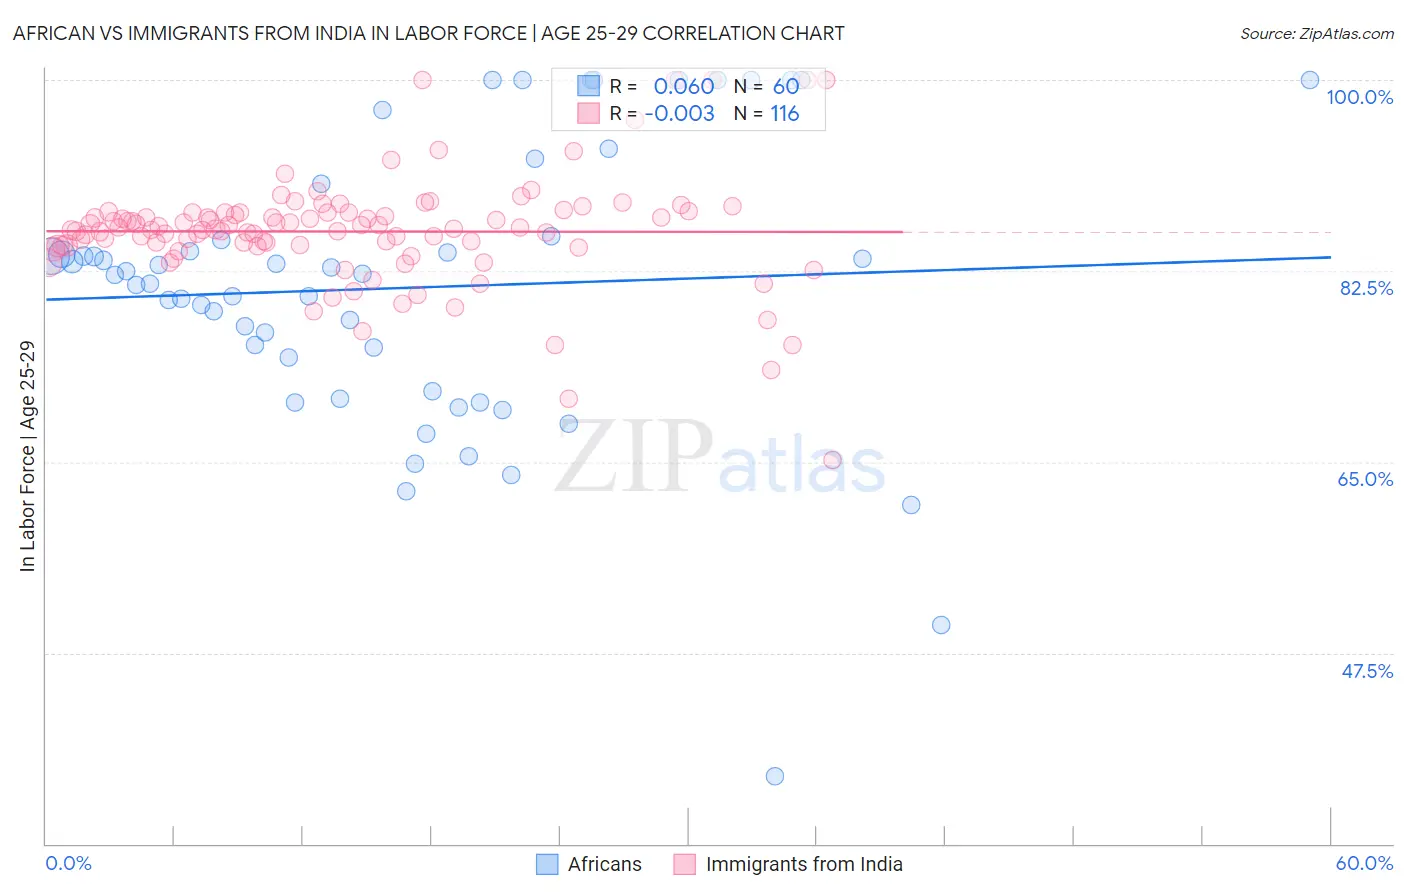
African vs Immigrants from India In Labor Force | Age 25-29 Correlation Chart
The statistical analysis conducted on geographies consisting of 469,793,386 people shows a slight positive correlation between the proportion of Africans and labor force participation rate among population between the ages 25 and 29 in the United States with a correlation coefficient (R) of 0.060 and weighted average of 83.2%. Similarly, the statistical analysis conducted on geographies consisting of 433,894,506 people shows no correlation between the proportion of Immigrants from India and labor force participation rate among population between the ages 25 and 29 in the United States with a correlation coefficient (R) of -0.003 and weighted average of 85.7%, a difference of 2.9%.
In Labor Force | Age 25-29 Correlation Summary
| Measurement | African | Immigrants from India |
| Minimum | 36.2% | 65.2% |
| Maximum | 100.0% | 100.0% |
| Range | 63.8% | 34.8% |
| Mean | 81.0% | 86.1% |
| Median | 82.2% | 86.3% |
| Interquartile 25% (IQ1) | 73.0% | 84.8% |
| Interquartile 75% (IQ3) | 85.5% | 87.8% |
| Interquartile Range (IQR) | 12.5% | 3.0% |
| Standard Deviation (Sample) | 13.1% | 5.1% |
| Standard Deviation (Population) | 12.9% | 5.1% |
Similar Demographics by In Labor Force | Age 25-29
Demographics Similar to Africans by In Labor Force | Age 25-29
In terms of in labor force | age 25-29, the demographic groups most similar to Africans are Immigrants from Cuba (83.2%, a difference of 0.050%), British West Indian (83.2%, a difference of 0.060%), Samoan (83.3%, a difference of 0.070%), Immigrants from Honduras (83.3%, a difference of 0.070%), and Dominican (83.2%, a difference of 0.080%).
| Demographics | Rating | Rank | In Labor Force | Age 25-29 |
| Basques | 0.0 /100 | #270 | Tragic 83.4% |
| Hondurans | 0.0 /100 | #271 | Tragic 83.4% |
| Immigrants | Caribbean | 0.0 /100 | #272 | Tragic 83.4% |
| Immigrants | Dominica | 0.0 /100 | #273 | Tragic 83.4% |
| Marshallese | 0.0 /100 | #274 | Tragic 83.3% |
| Samoans | 0.0 /100 | #275 | Tragic 83.3% |
| Immigrants | Honduras | 0.0 /100 | #276 | Tragic 83.3% |
| Africans | 0.0 /100 | #277 | Tragic 83.2% |
| Immigrants | Cuba | 0.0 /100 | #278 | Tragic 83.2% |
| British West Indians | 0.0 /100 | #279 | Tragic 83.2% |
| Dominicans | 0.0 /100 | #280 | Tragic 83.2% |
| Immigrants | Dominican Republic | 0.0 /100 | #281 | Tragic 83.1% |
| Americans | 0.0 /100 | #282 | Tragic 83.1% |
| Immigrants | Azores | 0.0 /100 | #283 | Tragic 83.1% |
| Nicaraguans | 0.0 /100 | #284 | Tragic 83.1% |
Demographics Similar to Immigrants from India by In Labor Force | Age 25-29
In terms of in labor force | age 25-29, the demographic groups most similar to Immigrants from India are Immigrants from Eritrea (85.7%, a difference of 0.010%), Macedonian (85.7%, a difference of 0.010%), Immigrants from Sierra Leone (85.7%, a difference of 0.010%), Czech (85.6%, a difference of 0.040%), and Immigrants from Greece (85.7%, a difference of 0.050%).
| Demographics | Rating | Rank | In Labor Force | Age 25-29 |
| Immigrants | Nepal | 99.9 /100 | #36 | Exceptional 85.8% |
| Poles | 99.9 /100 | #37 | Exceptional 85.8% |
| Sierra Leoneans | 99.9 /100 | #38 | Exceptional 85.8% |
| Croatians | 99.9 /100 | #39 | Exceptional 85.8% |
| Immigrants | Albania | 99.9 /100 | #40 | Exceptional 85.7% |
| Immigrants | Greece | 99.9 /100 | #41 | Exceptional 85.7% |
| Immigrants | Eritrea | 99.9 /100 | #42 | Exceptional 85.7% |
| Immigrants | India | 99.9 /100 | #43 | Exceptional 85.7% |
| Macedonians | 99.9 /100 | #44 | Exceptional 85.7% |
| Immigrants | Sierra Leone | 99.9 /100 | #45 | Exceptional 85.7% |
| Czechs | 99.8 /100 | #46 | Exceptional 85.6% |
| Turks | 99.8 /100 | #47 | Exceptional 85.6% |
| Italians | 99.8 /100 | #48 | Exceptional 85.6% |
| Swedes | 99.8 /100 | #49 | Exceptional 85.6% |
| Yugoslavians | 99.8 /100 | #50 | Exceptional 85.6% |